
The Intangible Drivers of Financial Crises. Part 1
[Чтобы прочитать русскую версию статьи, выберите русский в языковом меню сайта.]
Evsey Gurvich is head of the Economic Expert Group and a senior researcher at the Financial Research Institute.
For citation: Gurvich, Evsey, 2023. The Intangible Drivers of Financial Crises, Contemporary World Economy, Vol. 1, No 1, January–March.
Keywords: financial crisis, self-fulfilling predictions, uncertainty indicators, crisis contagion, Russian anti-crisis policy.
Abstract
This article examines the role of intangible factors (negative expectations, lack of confidence, and uncertainty shocks) in the development of financial crises. These factors can trigger conventional crisis mechanisms (such as the formation of credit booms), intervene when fundamentals are weak, or act autonomously (e.g., in the case of a bank run). The first part of this paper presents a brief review of the literature along two dimensions: the development of second-generation models of currency crises, and an analysis of the impact of intangible factors, informed by new ways of measuring them. In particular, the study finds that uncertainty about economic conditions and policies has a significant negative impact on output (mainly by reducing investment activity) but also significantly weakens the effect of fiscal and monetary stimulus measures. In the next part, we discuss alternative approaches to assessing economic agents’ confidence in their governments and central banks, the different types of uncertainty, and the development of such parameters in Russia.
Introduction
Financial crises (FC), which, according to Reinhart and Rogoff (2008), were first documented in the 14th century, continue to be an important part of the global economy. Their negative impact affects all aspects of the economy, including budgets, inflation, production, the banking sector, and household income, and ultimately leads to enormous losses. Furceri and Zdzienicka (2012) estimate the decline in GDP in the first year of the debt crisis at 3-5% relative to trend. Similar results were found by Sufi and Taylor (2021). According to their calculations, which take into account all financial crises since 1870, GDP is on average 5% below the previous trend three years after the start of the crisis. It is important to add that the post-crisis contraction in GDP is not temporary, but long-lasting: the fall in output that occurred immediately after the crisis persists (metaphorically speaking, it “leaves scars”), and in some cases the gap with the previous trajectory actually widens over time (Cerra, Saxena 2023, Chen, Mrkaic, Nabar 2019).
Globalization, which has greatly increased trade, financial, and information connectivity between nations, has recently led to the internationalization of FCs. For example, in 2009, during the “Great Recession”1, almost half of the 85 large and medium-sized economies with a share of world GDP2 of at least 0.1%3 were in recession (before the crisis, in 2007, only 1% of countries were in recession). Overall, the world economy (aggregated by PPP) contracted by 0.1% in 2009 instead of the expected growth rate of 3.9%. In other words, the global damage to the world economy in that year alone is estimated at USD 3.4 trillion (equivalent to 4% of the global GDP). However, the total losses are incomparably greater if the long-term consequences are taken into account. Another recent feature is that the arsenal of tools for dealing with financial crises has been steadily expanding, and the measures it contains (such as maintaining near-zero interest rates or “quantitative easing”) are increasingly longer-term rather than ad hoc. As a result, anti-crisis policies are gradually becoming chronic; measures introduced in the midst of a crisis are then maintained for many years, often paving the way for subsequent crises. As a result, macroeconomic policies in most of the world’s leading economies in the 21st century have actually focused on mitigating the effects of the last financial crisis or preventing the next one. Another relatively recent trend is that crises are becoming more complex: they tend to affect all or many components of the financial system at the same time. Given the growing scale and variety of financial crises, the need for a “unified theory of business cycles” that would encompass all types of shocks–real, trade, financial, etc.–has become increasingly urgent (Grigoryev, Ivashchenko 2010). Berger, Richter, and Wong (2022), for example, took a step in this direction.
The concept of a Financial Crisis is broadly defined as an abrupt and unexpected change in financial sector conditions (serious problems in the banking system or debt markets, exchange rate spikes, etc.). Commonly, all crises are classified into four types: banking crises, balance of payments crises (“sudden stop”), currency crises, and debt crises. To keep our description relatively consistent, we focus mainly on currency and debt crises interpreted as broadly as possible. We define a currency crisis as a sharp depreciation of the managed exchange rate of a national currency, a change in the exchange rate policy regime under market pressure, or the forced adoption of serious and usually painful measures to protect the status quo (such as the sale of significant amounts of foreign exchange reserves or a substantial increase in the refinancing rate). A debt crisis implies any situation in which the government and/or a large part of the non-public sector breaches its obligations to creditors (not only formal ones, but also informal ones, for example, by eroding the real value of the debt through inflation). The general conclusions of this paper are fully applicable to other types of financial crises. For a general description of the different types of financial crises, see, for example, Claessens, Kose (2013), Sufi, Taylor (2021).
The enormous impact of crises on the global economy has led to intense focus on the causes of their emergence, mechanisms of their propagation, the means of their prevention and mitigation, and other similar issues. For a long time, the focus of such an analysis was on classical fundamental factors with specific quantitative dimensions (such as the size of public debt, external imbalances, etc.) that were familiar to all actors. A few decades ago, the range of indicators used to study crises began to expand to include selected “intangible” factors (IFs). The latter are characterized by the fact that they exist only as perceptions of economic agents (households, investors, public authorities, etc.) and are therefore not directly measurable. Of course, each agent knows only his/her own expectations and assessments.
IFs such as inflation and exchange rate expectations or consumer confidence were the first to be considered in economic research. Initially, intangible factors were presented as a function of fundamentals, whenever possible. Thus, the concept of “rational expectations” reduced everyone’s expectations to the best predictions that could be made on the basis of available macroeconomic information. IFs, which were introduced later, are not reduced to macroeconomic indicators but require the consideration of discrepancies between the expectations of different participants, asymmetry in available information, coordination problems of agents, potential irrationality of their decisions, and other similar factors. This has led to a significant broadening of the arsenal of tools for analyzing crises: first game theory methods, then behavioral and experimental economics, psychology, etc. The inclusion of immaterial factors in the analysis is a clear step towards a more realistic description of crisis mechanisms, since the notion of the economic actor as a representative agent guided by rational expectations has long been recognized as a rather limited representation of reality.
Recently, a number of new models of crisis initiation and evolution have been proposed that take greater account of the role of intangible factors, while some indicators have been constructed to quantify the main NFs. New research has shown that intangible factors (such as economic agents’ expectations) are often of comparable importance to conventional effects and are often closely linked to the latter in the context of crisis mechanisms. The ongoing reassessment of the mechanisms of financial crises has led to adjustments in the way crises are handled. For example, the ECB has cited the need to dampen negative self-fulfilling expectations as a justification for a program of “direct monetary operations,”4 i.e. the purchase of euro area bonds on the secondary market (Draghi 2012).
Despite the fact that globally NFs have gained prominence in contemporary theoretical and empirical work on the crisis and are already taken into account in practical decision-making, their role in Russia seems to be not yet sufficiently understood by economists and state authorities. Both an understanding of international experience and active efforts to measure and analyze the impact of intangibles on the Russian economy are needed to ensure that they are included in the standard arsenal of anti-crisis programs or macroeconomic sustainability measures. This study attempts to make progress in these directions. We will also show how accounting for intangibles can contribute to the prevention and mitigation of new financial crises.
Literature review
Due to the sheer number of studies on the subject, we will only mention selected works on the general characteristics of financial crises and key publications highlighting the role of intangible factors.
Recent studies clarify the channels and nature of the impact of financial crises on the economy. In particular, they confirm the importance of the previously identified link between financial crises and preceding credit booms and/or financial bubbles.5 During a boom, the rate of credit growth increases by a factor of 2 to 3 compared to normal credit growth, and the subsequent credit contraction occurs 10 to 15 times faster than during the downturn phase of the normal business cycle (Claessens, Kose, Terrones 2010).
Further evidence of this link is that “credit booms” and “bubbles” are good predictors of the forthcoming development of FCs. For example, after three years of accelerated credit and asset price growth, the probability of a financial crisis in the next three years rises to 40% compared to 7% under normal conditions (Greenwood et al. 2022).
The crisis mechanism is triggered after a boom is replaced by a credit crunch. The trigger for this transition is sometimes an unexpected event that changes the mood or expectations of economic agents, but more often the reasons are objective - for example, related to a sharp increase in debt servicing costs (Drehmann, Juselius, Korinek 2018). The credit crunch further leads to a decline in investment and a sharp fall in output; the mechanisms of this process are discussed in detail by Bernanke (2018).
The above findings seem to suggest that fundamental factors play a crucial role in shaping crises. In reality, however, this view does not take into account the next level of analysis - the causes of booms and busts. Most authors see the availability of “cheap money” as a fundamental reason for their emergence. For example, Dell’Ariccia, Igan, and Laeven (2012) use the U. S. subprime crash as an example to show how the expansion of credit at low interest rates lowered borrowers’ creditworthiness requirements and thus laid the groundwork for the subsequent financial crisis. Jimenez et al (2014) confirm, on the basis of a large dataset (containing information on 23 million loans granted by Spanish banks), that lower interest rates lead to an increase in the credit risks assumed by banks. This occurs through forced lending to borrowers with no (or poor) credit history, a lack of reliable collateral, etc. Cheap money also plays a leading role in “bubble inflation” (Brunnermeier, Rother, Schnabel 2020).
However, in many cases, intangible factors also contribute significantly to credit booms and bubbles. In particular, the expectations of economic agents regularly deviate from rationality due to the frequent extrapolation of past trends into the future. Using panel data from 17 developed countries over the period from 1870 to 2015, Richter and Zimmermann (2019) show widespread “inertial” expectation formation by banks, which take good performance in the previous period as a sign of economic recovery and expand lending.
For their part, government forecasts also systematically overstate the future, much of it due to “bottom-up” macroeconomic planning (Carrière-Swallow, Marzluf 2021). Such optimism ultimately leads to excessive debt accumulation by governments, firms, and households, creating conditions for crisis (Beaudry, Willems 2022).
International experience leads us to agree with the well-known thesis of Reinhart and Rogoff (2008) that economic agents are characterized by unjustified optimism, not only in forecasting but also in assessing the current situation. After analyzing the history of crises over a long period of time, they come to the conclusion that “this time will be different,” a syndrome typical of investors: even when there are clear and well-known signs of credit booms and busts from the past, investors still repeatedly neglect the coming danger.
Another explanation for credit booms and busts focuses on investor motivation, which is driven by intangible factors. Such models describe how booms or busts can arise as a result of differences in the information available to agents, their preferences and behavior (e.g., the prevalence of “herding behavior,” where less experienced agents repeat the actions of more experienced ones), heterogeneity in investors’ valuations and expectations. Scherbina, Schlusche (2014) and Xiong (2013) provide a brief overview of this class of models as applied to the study of bubbles.
Intangible factors may combine with fundamental factors in the mechanisms of crisis formation, but they may also play distinct roles on their own. One example is the Nobel Prize-winning model of “bank panic” (Diamond, Dybvig 1983), which shows that the crisis of a solvent bank can be triggered by self-fulfilling negative expectations of depositors. Put simply, if a large enough number of depositors expect a run, they will rush to withdraw their money and a real banking crisis will occur; otherwise, depositors will continue to leave their money in the bank and no crisis will occur. As a result, the outcome does not depend on the fundamental characteristics of the bank (its solvency or liquidity), but is entirely determined by the opinion of depositors, who may have no direct knowledge of the true state of affairs. Subsequently, a number of more sophisticated models of bank runs have been proposed (for a review, see Ennis and Keister 2010).
A clear and well-known illustration of the differences between the mechanics of fundamentals and intangibles is provided by first- and second-generation models of currency crises. First-generation models (Krugman 1979; Flood, Garber 1984) show how the presence of fundamental imbalances (chronic budget deficits), combined with unsustainable macroeconomic policies, inevitably leads to a crisis through speculative attack.
In the 1980s, cross-border capital flows were 80% government borrowing, so currency crises were mainly caused by government macroeconomic policy failures, as described by the first-generation models. As a result of the vigorous financial liberalization of the 1990s, private sector capital flows came to the fore. As new complicated financial instruments emerged, capital market regulation became more important and banks’ asset-liability management became more sophisticated. The financial crises from Latin America to East Asia in the 1990s were markedly different in nature. The analysis of their mechanisms led to the emergence of second-generation models that focused on the issue of coordination between different actors. Obstfeld (1986), for example, considers a situation in which there is no need to devalue as long as external investors continue to buy government debt denominated in the national currency. However, if they fear future devaluation and stop buying, the central bank is forced to lower the exchange rate. The onset of a crisis is determined solely by investor expectations (whatever they may be) and has nothing to do with the fundamentals. Obstfeld (1996) builds a more elaborate model in which investors independently decide on a speculative currency attack, which is successful if enough investors participate. The required number of participants depends on the strengths or weaknesses of the fundamentals. It is shown that three situations are possible: a) when the fundamentals are weak (large imbalances, small reserves), an attack and devaluation are inevitable; b) when the fundamentals are strong, devaluation does not occur; and c) in the intermediate zone (which can be quite broad), the outcome is determined by self-fulfilling expectations of investors. In such a situation, any one of these options can occur, i.e. the crisis is unpredictable. Whether or not it occurs depends on the coordination of investors, which may result from the accidental spread of a signal (such as a sovereign rating upgrade or downgrade) or from other, completely unforeseeable events. Another possibility is that it will not happen at all.
Similar models were developed for self-fulfilling debt crises. Calvo’s (1988) study is particularly noteworthy. He considered a situation in which a government defaults on all or part of its debt obligations if the benefits of such a decision exceed the losses (in this case, the default is strategic). The interest rate on borrowing is determined by investors’ estimates of the expected value of losses from default. It is shown that two equilibria are typical: “good” (when investors do not expect a default, do not price its risk into the interest rate, and it does not occur) and “bad” (when investors buy debt at a higher rate, taking into account the probability of default, and the government partially defaults). Given the same fundamentals, both the first and the second equilibria can occur; therefore, the default is only determined on the basis of investors’ expectations.
Another important model (Cole, Kehoe 2000) assumes that the government is solvent but not liquid, i.e. it cannot service its debt unless it is refinanced by investors. If the number of investors willing to buy the government's bonds is insufficient, the government has to choose between default and other options such as cutting spending, raising taxes, or tapping additional reserves. Each investor independently forms expectations about the actions of other investors and the government, and makes decisions based on them. It is shown that under fairly natural assumptions, as in the currency crisis model, there are three zones: with relatively low government dependence on debt refinancing6 default is ruled out, with very high dependence default is inevitable, and with moderate dependence there are multiple equilibria (i.e., the outcome is determined by investors’ self-fulfilling expectations).
Finally, there is a group of studies that consider weaknesses within the financial system and/or distorted incentives for its actions as the main source of crises (these are conventionally referred to as third-generation models). For example, in one of the first papers of this generation, McKinnon and Pill (1995) show how financial liberalization combined with bank deposit insurance can stimulate a credit boom and eventually lead to a banking and currency crisis. As noted below, such mechanisms played an important role in the financial crises of the 1990s.
The above basic models have been developed in numerous other studies, many of which have been motivated by a desire to describe the mechanisms of the severe Eurozone debt crisis that emerged as a result of the “Great Recession.” Some of these models are discussed below.
The other major group of “intangible factors” relate to the degree of predictability of the economic situation. More than 100 years ago, Knight (Knight 1921) introduced the important concept of “uncertainty,” but it has only recently become an active tool of economic analysis. The literature has a long history of studies on the effects of economic risks. However, uncertainty differs fundamentally from risk in that there is a lack of information on both the magnitude of possible adverse shocks and the probability of their occurrence. In such a situation, the risk-averse entrepreneur postpones actions associated with irreversible costs, i.e., he pauses capital investment, reduces orders for raw materials and components and suspends hiring. Households, in turn, make additional savings in case of unforeseen challenges. Reduced bank lending is another important channel of uncertainty. Alessandri and Bottero (2020), after analyzing data on two million applications received by Italian banks from corporate borrowers between 2004 and 2012, show that high uncertainty simultaneously reduces the probability of a loan being granted and increases the time until it is granted. These effects lead to the manifestation of self-fulfilling negative expectations: domestic demand, consumption, investment, and production fall, while unemployment rises.
The concept of uncertainty as an intangible factor that changes under the influence of significant and unpredictable events of any kind - economic, geopolitical, natural, etc.–is now well established (e.g., in the event of a major military conflict, disruption of world oil supplies, outbreak of a pandemic, etc.). However, the source of uncertainty is often destabilization caused by the onset of a financial crisis. In both cases, increased uncertainty has a negative impact on economic activity, although the mechanisms may differ. In the case of external sources of uncertainty, this intangible factor acts as a channel through which shocks (among other factors) affect the economy, while when uncertainty arises as a response to the onset of a crisis, it becomes part of the overall crisis mechanism, exacerbating its negative effects. Although uncertainty shocks can act as primary or secondary to other crisis factors, they have an additional independent effect on the economy over and above the other effects (Caldara et al. 2016).
Empirical studies confirm that increased uncertainty plays a significant role in the overall negative impact of crisis shocks. For example, between 1981 and 2014, global financial uncertainty accounted for almost one-fifth of the variation in global economic growth and one-seventh of the variation in global inflation (Kang, Ratti, and Vespignani 2020). During the Great Recession, uncertainty accounted for more than one-third of losses in the U.S. economy (Bloom 2014). Baker et al. (2020) estimate that uncertainty associated with the pandemic accounts for about half of the decline in the U. S. economy in 2020. In terms of the mechanisms through which uncertainty affects output, the most important channel is reduced investment, while reduced consumer demand is an additional channel (Bloom 2014). Other researchers come to similar conclusions: For example, Meinen and Roehe (2017), analyzing data for the largest European countries for 1996-2015, show a significant impact of uncertainty on fixed investment.
A feature of the impact of uncertainty on output is its nonlinear nature. When uncertainty is close to the normal level, its fluctuations do not have a noticeable impact on the economy. However, in a pre-crisis or crisis situation, when uncertainty spikes, the impact on the real sector becomes really strong (Jackson, Kliesen, Owyang 2018).
Another intangible factor that complements the previous one is “economic policy uncertainty” (EPU). This refers to the uncertainty of economic agents about what decisions will be taken by the government and the central bank (e.g., on the size of the budget deficit or the refinancing rate). The source of this uncertainty is the commitment of the authorities to discretionary measures, as well as the occurrence of non-standard situations that require an urgent response (such as economic sanctions, the outbreak of a pandemic, etc.). The negative effects of economic policy uncertainty on investment, production, labor market, and financial markets have been convincingly confirmed empirically in a number of studies. For example, a one standard deviation increase in the EPU index increases the probability of a recession by 14% and reduces the probability of its end by 27%, all other things being equal. In other words, EPU simultaneously increases the probability of a financial crisis starting and its duration (Nguyen 2022).
For an in-depth analysis of the roots of economic uncertainty, different sources of uncertainty are often considered, such as political (Leblang, Satyanath 2008) or geopolitical risk (Caldara, Iacoviello 2022). Fedorova, Musienko, and Fedorov (2019) constructed a political uncertainty indicator for Russia; the geopolitical risk index for our country is regularly calculated using a common methodology (the results are discussed below). The components of the ECU and EPU are also studied, such as financial uncertainty (i.e., uncertainty about financial conditions in the country), uncertainty about monetary or fiscal policy, etc. Typically, particular types of uncertainty also show a negative impact on economic activity. For example, Husted, Rogers, Sun (2020) show that monetary policy uncertainty, as measured by their proposed indicator, increases the cost of borrowing and reduces economic activity. However, the magnitude of these effects is comparable to the effects of conventional economic policies.
For Russia, oil price uncertainty (OPU) appears to play an important role. The analysis suggests that this indicator has a significant two-way relationship with the uncertainty in individual countries. For example, the EPU index in the largest countries has a direct impact on OPU (Bahmani-Oskooee, Harvey, and Niroomand 2018). Meanwhile, EPU shocks in the U.S., Europe, Russia, and China have a short-term effect on OPU, while China’s EPU growth has a long-term effect on OPU (which makes sense, as global oil demand in recent decades has been largely driven by China’s consumption patterns). At the same time, rising OPU has a negative impact on the industrial output of oil-exporting countries and, in the case of emerging markets (such as Russia or Mexico), on the exchange rate of the national currency (Smiech et al. 2021).
Indicators of the intangible drivers of financial crises
Let us consider ways to measure key intangible indicators that play an important role in the mechanisms of financial crises.
Level of credibility
Credibility in monetary or fiscal policy implies the confidence of economic agents that the central bank or government is willing to follow its stated policy and achieve its objectives, even at the cost of implementing difficult and unpopular measures. This implies a combination of high-quality macroeconomic policies and a strong political will to achieve the set goals. For brevity, we limit our discussion to the credibility of fiscal policy.
What are the benefits of maintaining a high level of confidence? It reduces the risk for investors and, thus, makes government borrowing cheaper. It also increases the government’s flexibility in crisis situations: it can spend heavily on anti-crisis measures without losing access to capital markets, as investors remain confident that the government will subsequently return the budget deficit and public debt to safe levels. In particular, high confidence limits the impact of many negative shocks, including increased uncertainty. Government taxes, spending and borrowing are the main source of uncertainty in economic policy, so it is particularly important to maximize the predictability of decisions in this area. Otherwise, there is a risk that even relatively small negative shocks will lead to a reduction in aggregate demand, an increase in interest rates and a decline in output.
Among the various approaches to measuring confidence in fiscal policy, the indicators proposed by End, Hong (2022) appear to be the most convincing. They suggest that high confidence should be indicated by the convergence of independent forecasts and expectations with the government’s announced fiscal policy parameters. The key indicator used in this paper is the budget balance for the following year (expressed as a percentage of GDP). The government’s target is the deficit (or surplus) approved in the budget law, while agents’ expectations are characterized by the forecasts of Consensus Economics, which collects monthly forecasts from over 700 independent sources.
For each country, three complementary indicators have been considered A) the average (over the whole period of the forecasts of the indicators of the country by the experts of Consensus Economics) deviation of the independent forecasts of the budget balance from the official indicators, B) the average absolute deviation of the same forecasts, C) the variance of the forecasts between different sources. Indicator A shows whether the official budget forecasts, as judged by external experts, contain systematic biases (e.g., excessive optimism). Indicator B characterizes the accuracy of the official budget figures from the perspective of the experts. Finally, indicator C characterizes the homogeneity of economic agents’ expectations (it should serve as one of the consequences of confidence in the government’s fiscal policy).
Symbolically, in the sample of 41 countries7 considered by End, Hong (2022), the largest “optimistic bias” in official forecasts, as well as the largest absolute deviation from independent estimates, are characteristic of the countries most affected during the last two international financial crises (the Great Recession and the pandemic): Ireland, Greece, India, Spain and Portugal. The budget projections of the Swiss, Czech, and Dutch governments are perceived as the most accurate.
Analysis based on constructed indicators confirmed the assumption that confidence significantly reduces the cost of borrowing and improves a country’s credit rating. According to End, Hong (2022), confidence-building factors include the existence of basic budget rules, independent monitoring of compliance and multi-annual budget planning. All these factors are designed to make budget execution predictable, of which the budget deficit is the most important for investors. Accordingly, the intermediate outcome of these institutions should be, above all, an accurate forecast of the budget deficit.
Oil-exporting countries cannot adequately control and predict their oil and gas revenues; moreover, it is a sound policy for them to moderate the use of such revenues. For Russia and other oil-exporting countries, therefore, credibility depends on meeting the announced targets for non-oil and gas deficits as closely as possible. Such a comparison is different from the one discussed above, but it is an important prerequisite for trust in government.
Figure 1 shows the dynamics of the two characteristics of Russia’s non-oil and gas deficit of the federal budget: the statutory value for the corresponding year (without taking into account subsequent amendments to the law) and the actual value. As in the case of the confidence indicators considered above, it is possible to identify various characteristics of fiscal policy: a) prudence (the average difference between the actual and the plan), b) accuracy (the average absolute deviation of the actual from the plan). As can be seen from the graph, for most of the period under review, the government’s fiscal policy was prudent (the planned deficit was very rarely exceeded) and fairly accurate. However, both indicators deteriorated significantly in 2009-2011 and 2020-2022. The estimated values of the indicators in question for the different periods are shown in Table 1 (the precautionary indicator is positive when the actual deficit is lower than the planned one). We note that after the widening of the gap between planned and actual deficits in 2009 and the significant overrun of the planned non-oil and gas deficits, the government restored the former ratio rather quickly. The same target is currently relevant.
Figure 1. Non-oil and gas deficit of the federal budget (plan/actual)

Source: author’s calculations, data from the Federal Ministry of Finance.
Table 1. Gap between planned and actual non-oil and gas deficit of the federal budget (% of GDP)
|
Average by period |
2000-2008 |
2009-2011 |
2012-2019 |
2020-2022 |
|
Planning caution |
0.9% |
-1.1% |
0.9% |
-0.7% |
|
Planning accuracy |
1.0% |
4.5% |
1.0% |
3.7% |
Source: author’s calculations based on data from the Federal Ministry of Finance
Economic conditions uncertainty (ECU)
To date, a fairly wide range of indicators of uncertainty has been developed, varying in terms of their objects (the world economy, a group of countries, a single country, regions of a country - although the latter scenario is rather rare) and their approach to measurement.8 These approaches can be divided into several groups:
Based on market indicators
Such indicators are typically derived from data on the volatility of expected stock or bond prices. The best known method is the one proposed by Bloom (2009), which uses the VIX measure of the volatility of stock index options. The same author has shown, both theoretically and empirically, that an increase in uncertainty measured in this way leads to a reduction in investment and labor demand.
Based on econometric structural models
Indicators of this type are based on the fact that uncertainty is characterized by the deviation of the actual values of the main macroeconomic indicators from the forecasts of qualified experts, i.e. by the degree of unpredictability. Accordingly, the desired indicator can be constructed as a weighted average of the conditional volatility of a wide range of macroeconomic indicators. The most famous work applying this approach was published by Jurado, Ludvigson, Ng (2015). An indicator of this type of uncertainty for Russia was constructed by Prilepski (2022).
Based on media coverage
Uncertainty is assessed by the frequency with which words or phrases related to economic events and forecasts are mentioned in the country’s leading publications. An example of this approach is presented by Alexopoulos, Cohen (2015), who propose to measure the uncertainty of economic conditions by the number of stories in the New York Times, the leading newspaper in the United States, that contain the word “economy” or “economic” combined with the word “uncertain” or “uncertainty.”
Based on surveys of economists/managers or analysis of their forecasts
Uncertainty is derived from the analysis of experts’ macroeconomic forecasts or managers’ expectations regarding the demand for their companies’ products, their companies’ production, etc. The assessment of uncertainty can be determined both by the content of the answers (as in Altig et al. 2022) and by the degree of divergence between them (Claveria 2020). For example, a long-term analysis of US industrial production forecasts by a panel of Federal Reserve Board experts found that the standard deviation of their forecasts increased by an average of 64% during recessions. A related approach is to assess the confidence of experts in their forecasts. For example, since 1992, the Philadelphia Fed has asked economists to indicate the probability distribution of different variants of expected growth rates. The analysis suggests that as a recession begins, both the degree of divergence between different experts’ forecasts and the dispersion of individual experts' expectations (i.e. their uncertainty) increases (Bloom 2014).
Although these approaches do not provide identical estimates, the uncertainty estimates constructed in different ways have some common features, in particular they all show a negative relationship with economic activity and rise sharply in recessionary periods. However, an analysis of the papers that directly or indirectly compare different indicators of uncertainty suggests that the best way to describe it is the macroeconomic uncertainty indicator developed by Jurado et al. (2015). In particular, this indicator can be considered the most exogenous, i.e., when used, there is no doubt about the direction of causality within the observed relationships (Meinen, Roehe 2017).
Economic policy uncertainty (EPU)
In addition to general economic policy uncertainty, a wide range of indicators have been developed to describe uncertainty in monetary, fiscal, trade, regulatory and other policy components. The methods used to construct such indicators can be classified into the same types as those used to assess economic uncertainty discussed above. Thus, Bauer (2012) proposes a method to estimate monetary policy uncertainty from the volatility of expectations of the future refinancing rate, while Husted, Rogers, Sun (2020) construct the same indicator based on text message analysis.
Beckmann, Czudai (2021) measure fiscal policy uncertainty from the spread between professional forecasts, while Anzuini, Rossi, Tommasino (2020) estimate structural models describing the volatility of the fiscal policy response to changes in the level of public debt (i.e., the dependence of the primary fiscal balance on changes in debt). Basic indicators of trade policy uncertainty are considered, e.g., Handley, Limao (2022).
In regard to economic policy uncertainty in general, the most authoritative indicator is the EPU indicator based on media content analysis developed by Baker, Bloom, Davis (2016). This indicator is based on counting articles in 10 leading US publications that contain a combination of three categories of terms: a) “economy/economics”, b) “uncertain/uncertainty”, c) “Congress/White House/Federal Reserve/deficit/legislation/regulation”. This approach was later extended to a wide range of countries.
From a practical point of view, the simplest way to assess uncertainty is through textual analysis. However, there are concerns about using this approach in countries where there is a high degree of government control over the media. Such control can lead to restrictions and misrepresentations in the content of publications - and therefore in the measurement of uncertainty. Yet many of the world’s largest economies rank low in the world press freedom rankings, with countries such as China, India, Turkey, and Russia in the bottom quintile of this ranking9 for 2022.
A regularly updated series of World Uncertainty Indexes (WUI) and Economic Policy Uncertainty Indexes (EPU) are now freely available. The first of these indices is calculated by the Economist Group’s Analytical Unit, based on an analysis of the text of Economist Group reports on the country in question, following the methodology proposed by Ahir, Bloom and Furceri (2022). WUIs are published for 143 countries on a quarterly basis since 1950.10 The GDP-weighted average of the indices for all countries in the sample forms a global uncertainty indicator. In addition, monthly uncertainty indices are calculated for 71 countries (including Russia) using the same methodology (from 2008). The EPU indices are calculated monthly by the Economic Policy Uncertainty research team for 24 major economies, including Russia, and for the world as a whole (as a weighted average).11 For almost all countries in the sample, rankings begin in 1997 or earlier. A wide range of other material on uncertainty is also available on the same website. These include monthly updated series of geopolitical uncertainty indices and a set of policy uncertainty indices for the US (monetary, fiscal, trade, financial regulation, etc.).
Figures 2 and 3 show the World Uncertainty Index (WUI) and the Economic Policy Uncertainty Index (EPU) for the world and Russia respectively. It is relatively easy to relate their dynamics to global events. The highest values of the WUI index relate to two adjacent periods: 2019 (the US-China trade conflict and Brexit) and 2020 (the start of the pandemic). The next peaks of this indicator relate to 2016 (the result of the Brexit referendum in the UK), 2022 (the start of hostilities in Ukraine), and 2017 (the inauguration of US President Donald Trump). The EPU indicator shows a broadly similar dynamic, although it varies considerably from period to period. The maximum values of this indicator are recorded in 2020 (pandemic), 2022 (military operation in Ukraine), 2019 (US-China trade war and Brexit), and early 2017 (start of Donald Trump’s presidential term). Surprisingly, during the “Great Recession” (2008-2010), the increase in the EPU was significantly lower than the recorded peaks, while the WUI hardly reacted at all to this crisis.
As can be seen in Figure 3, the differences between the two indicators in question are much greater for Russia than for the world economy. The record increase in the WUI in mid-2012 coincides with the peak of the European sovereign debt crisis, which also had a significant impact on the global WUI, while the highest EPU values occurred, as expected, during the pandemic and the start of the military operation in Ukraine. However, other variations in these indices do not always lend themselves to interpretation; moreover, the relatively weak response of the EPU to the “Great Recession” and the almost complete lack of response of the WUI index is again surprising.
Much more in line with intuition are the dynamics of economic uncertainty as constructed by Prilepski (2022). This indicator has two sharp spikes: in late 2008 and early 2009 (the “Great Recession”) and in late 2014, when the fall in oil prices and the move to a floating exchange rate led to a sharp appreciation of foreign currencies. This once again confirms the advantages of the Jurado (2015) approach, which is second only to the more popular indicators based on the analysis of news texts in terms of the complexity of their updating. For this reason, the ECU and EPU indicators are widely used in research as a measure of uncertainty in conditions and policies.
Figure 2: Indicators of global economic uncertainty
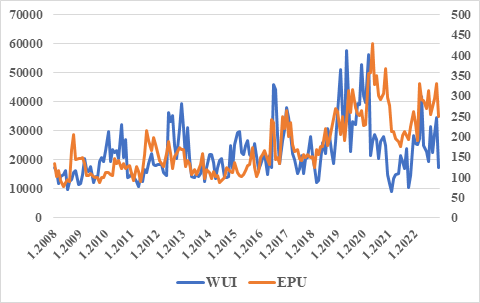
Source: author’s calculations based on Ahir, Bloom, Furceri (2022).
Figure 3: Uncertainty indicators for Russia
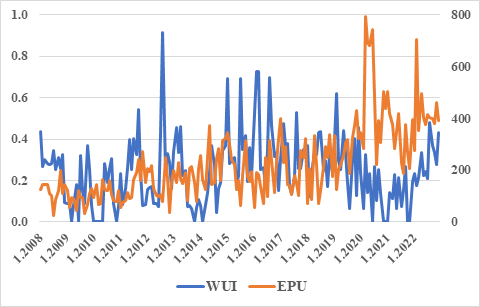
Source: author’s calculations based on Baker, Bloom and Davis (2016).
Let us briefly focus on another indicator mentioned above, the Geopolitical Risk Index (GPR). It is measured monthly for 43 countries (including Russia) based on the frequency of use of words referring to military threats, terrorist threats or acts, arms build-up, initiation or escalation of hostilities, etc.,12 the results are published at https://www.matteoiacoviello.com/gpr.htm. The GPR dynamics for Russia shown in Figure 4 have three small peaks and one very large one. The first two (short, several months each) began in September 2001 and September 2002, respectively, and most likely reflected the global geopolitical tensions that arose after the terrorist attacks on the Twin Towers in New York in the first case, and the US invasion of Iraq in the second. The next wave, during which the GPR tripled compared to the calm period of 2003-2013, was obviously related to Russia's annexation of Crimea. Finally, the fourth wave occurred after the start of the military operation in Ukraine, during which the GPR increased by almost seven times the base level. The average GPR values for the different periods are shown in Table 2.
Table 2. Average GPR values by period
|
Period |
July 2003–Jan. 2014 |
Feb. 2014–Aug. 2014 |
Oct. 2014– Oct. 2021 |
Nov. 2021–Feb. 2023 |
The total for Jan. 2000–Feb. 2023 |
|
Average value of GPR |
0.5 |
1.5 |
0.9 |
3.3 |
0.8 |
Source: author’s calculations based on Caldara, Iacoviello (2022).
Figure 4. Geopolitical Risk Index for Russia

Source: author’s calculations based on Caldara, Iacoviello (2022).
The article continues in the next issue of Contemporary World Economy.
Bibliography
Grigoryev, L.M. (ed.), 1998. Obzor economicheskoy politiki Rossii za 1997 god [Review of Russia’s Economic Policy in 1997], Bureau of Economic Analysis.
Aastveit, K., Natvik, G., Sola, S., 2017. Economic uncertainty and the influence of monetary policy. Journal of International Money and Finance, Vol. 76, pp. 50-67.
Ahir, H., Bloom, N., Furceri, D., 2022. The World Uncertainty Index. NBER Working Paper 29763.
Akinci, O., Kalemli-Özcan, Ṣ., Queralto, A., 2022. Uncertainty Shocks, Capital Flows, and International Risk Spillovers, NBER Working Paper No w30026.
Alessandri, P., Bottero, M., 2020. Bank lending in uncertain times. European Economic Review, Vol. 128, Issue C.
Alexopoulos, M., Cohen, J., 2015. The power of print: Uncertainty shocks, markets, and the economy. International Review of Economics and Finance, 40, pp. 8–28.
Allen, M., Rosenberg, C., Keller, C. et al., 2002. A Balance Sheet Approach to Financial Crisis, IMF Working Paper No. 02/210.
Altig, D., Barrero, J., Bloom, N. et al., 2022. Surveying business uncertainty. Journal of Econometrics, Vol. 231, Issue 1, pp. 282-303.
Anzuini, A., Rossi, L., Tommasino, P., 2020. Fiscal policy uncertainty and the business cycle: Time series evidence from Italy. Journal of Macroeconomics, Vol. 65, 103238.
Ayres, J., Navarro, G., Nicolini, J., Teles, P., 2018. Sovereign default: The role of expectations. Journal of Economic Theory, Vol. 175, pp. 803-812.
Bahmani-Oskooee, M., Harvey, H., Niroomand, F., 2018. On the Impact of Policy Uncertainty on Oil Prices: An Asymmetry Analysis. IJFS, Vol. 6, Issue 1.
Baker, S., Bloom, N., Davis, D., Terry, S., 2020. COVID-Induced Economic Uncertainty, NBER Working Papers 26983.
Baker, S., Bloom, N., Davis, S., 2016. Measuring Economic Policy Uncertainty. The Quarterly Journal of Economics, Vol. 131, No 4, pp. 1593-1636.
Bauer, M., 2012. Monetary Policy and Interest Rate Uncertainty, Federal Reserve Board San Francisco Economic Letter, 2012-38.
Beaudry, P., Willems, T., 2022. On the Macroeconomic Consequences of Over-Optimism. American Economic Journal: Macroeconomics, Vol. 14, No 1, Jan., pp. 38-59.
Beckmann, J., Czudaj, R., 2021. Fiscal policy uncertainty and its effects on the real. Oxford Economic Papers, Vol. 73, Issue 4, pp. 1516–1535
Belke, A., Goemans, P., 2022. Uncertainty and nonlinear macroeconomic effects of fiscal policy in the US: a SEIVAR-based analysis. Journal of Economic Studies, Vol. 49, No 4, pp. 623-646.
Berger, T., Richter, J., Wong, B., 2022. A unified approach for jointly estimating the business and financial cycle, and the role of financial factors. Journal of Economic Dynamics and Control, Vol. 136, March.
Bernanke, B., 2018. The real effects of disrupted credit: evidence from the global financial crisis. Brookings Papers on Economic Activity, No 2, pp. 251–342.
Bhattarai, S., Chatterjee, A., Park, W., 2020. Global spillover effects of us uncertainty. Journal of Мonetary Economics, No 114, pp. 71–89.
Bloom, N., 2009. The Impact of Uncertainty Shocks. Econometrica, No 77, pp. 623–689.
Bloom, N., 2014. Fluctuations in Uncertainty. Journal of Economic Perspectives, Vol. 28, No 2, pp. 153–176.
Brunnermeier, M., Rother, S., Schnabel, I., 2020. Asset Price Bubbles and Systemic Risk. Review of Financial Studies, Vol. 33, Issue 9, pp. 4272–4317.
Caldara, D., Iacoviello, M., 2022, Measuring Geopolitical Risk. American Economic Review, Vol. 112, No 4, pp. 1194-1225.
Caldara, D., Iacoviello, M., Molligo, P. et al., 2020. The economic effects of trade policy uncertainty. Journal of Monetary Economics, Vol. 109, pp. 38-59.
Caldara, D., Fuentes-Albero, C., Gilchrist, S., Zakrajšek, S., 2016. The macroeconomic impact of financial and uncertainty shocks. European Economic Review, Vol. 88, pp. 185-207.
Calvo, G., 1988. Servicing the Public Debt: The Role of Expectations. American Economic Review, Vol. 78, No 4, pp. 647–661.
Carrière-Swallow, Y., Marzluf, J., 2021. Macrofinancial Causes of Optimism in Growth Forecasts. IMF Working Paper WP/21/275.
Castelnuovo, E., Pellegrino, G., 2018. Uncertainty-dependent effects of monetary policy shocks: A new-Keynesian interpretation. Journal of Economic Dynamics and Control, Vol. 93, pp. 277-296.
Cerra, V., Fatas, A., Saxena, S., 2023. Hysteresis and Business Cycles. Journal of Economic Literature, Vol. 61, no 1, pp. 181-225.
Chen, W., Mrkaic, M., Nabar, M., 2019. The Global Economic Recovery 10 Years After the 2008 Financial Crisis. IMF Working Papers WP/19/83.
Claessens, S., Kose, A., 2013. Financial Crises: Explanations, Types, and Implications. IMF Working Papers WP/13/28.
Claessens, S., Kose, M., Terrones, M., 2010. The Global Financial Crisis: How Similar? How Different? How Costly? Journal of Asian Economics, Vol. 21, No. 3, pp. 247-264.
Claveria, O., 2020. Measuring and assessing economic uncertainty. IREA Working Papers 202011. University of Barcelona.
Cole, H., Kehoe, T., 2000. Self-Fulfilling Debt Crises. Review of Economic Studies, Vol. 67, issue 1, pp. 91-116.
Conesa, J., Kehoe, T., 2017. Gambling for redemption and self-fulfilling debt crises. Economic Theory, Vol. 64, No 4, pp. 707-740.
Corsetti, G., Maeng, S., 2023. Debt crises, fast and slow. Robert Schuman Centre for Advanced Studies. Research Paper No. 2023/15.
Cuaresma, J., Slacik, T., 2008. Determinants of Currency Crises: A Conflict of Generations? Focus on European Economic Integration, Issue 1, pp. 126-141.
David, A., Veronesi, P., 2022. A Survey of Alternative Measures of Macroeconomic Uncertainty: Which Measures Forecast Real Variables and Explain Fluctuations in Asset Volatilities Better? Annual Review of Financial Economics, Vol. 14, Issue 1, pp. 439-463.
Dell’Ariccia, G., Igan, D., Laeven, L., 2012. Credit Booms and Lending Standards: Evidence from the Subprime Mortgage Market. Journal of Money, Credit and Banking, Vol. 44, No 2‐3, pp. 367-384.
Diamond, D. W., Dybvig, P. H., 1983. Bank runs, deposit insurance, and liquidity. Journal of Political Economy, Vol. 91, No 3.
Draghi, M., 2012. Introductory statement to the press conference, Frankfurt, 6 September; available online at <www.ecb.europa.eu/press/pressconf/2012/html/is120906.en.html>.
Drehmann, M., Juselius, M., Korinek, A., 2018. Going with the flows: New borrowing, debt service and the transmission of credit booms. NBER Working Paper 24549.
End, N., Hong, G., 2022. Trust What You Hear: Policy Communication, Expectations, and Fiscal Credibility. IMF Working Paper No 2022/036.
Ennis, H., Keister, T., 2010. On the Fundamental Reasons for Bank Fragility. Economic Quarterly. Vol. 96, No 1, pp. 33–58.
Fedorova, E., Musienko, S., Fedorov, F., 2019. Indeks politicheskoy neopredelyonnosti dlya rossiyskoy ekonomiki: tekstoviy analiz [Development of Russian political uncertainty index (RPUI): Textual analysis]. Economics of Contemporary Russia, No 2, pp. 52—64. <https:// doi.org/10.33293/1609-1442-2019-2(85)-52-64>.
Flood, R., Garber, P., 1984. Collapsing Exchange-Rate Regimes: Some Linear Examples. Journal of International Economics, Vol.17, pp. 1-13.
Furceri, D., Zdzienicka, A., 2012. How Costly Are Debt Crises? Journal of International Money and Finance, Vol. 31, no 4, pp.726–742.
Gilchrist, S., Zakrajsek, E., 2012. Credit Spreads and Business Cycle Fluctuations. American Economic Review, No 102, pp. 1692–1720.
Greasley, D., Madsen, J., 2006. Investment and Uncertainty: Precipitating the Great Depression in the United States. Economica, Vol. 73, No 291, pp. 393-412.
Greenwood, R., Hanson, S., Shleifer, A., Sorensen, J., 2022. Predictable Financial Crises. The Journal of Finance, Vol. 77, Issue 2, pp. 863-921.
Grigoryev, L., Ivashchenko, A., 2010. Teoriya tsikla pod udarom krizisa [Theory of the cycle under the impact of the crisis], Voprosy ekonomiki, No 10, pp. 31–55.
Gumus, I., 2016. Fiscal Uncertainty and Currency Crises. Review of Development Economics. Vol. 20, Issue 3, pp. 637-650.
Gurvich, E., Prilepskiy, I., 2010. Chem opredelyalas’ glubina spada v krizisnyy period? [What determined the depth of recession during the crisis period?], Zhurnal Novoy ekonomicheskoy assotsiatsii, No 8, pp. 55-79.
Gurvich, E.T., 2016. Evolyutsiya rossiyskoy makroekonomicheskoy politiki v trekh krizisakh [The evolution of Russian macroeconomic policy in three crises], Zhurnal Novoy ekonomicheskoy assotsiatsii, No 1, pp. 174-181.
Gurvich, E.T., Andryakov, A.D., 2006. Mekhanizmy rossiyskogo finansovogo krizisa [Mechanisms of the Russian financial crisis], Ekonomika i matematicheskiye metody, Vol. 42, No 2.
Handley, K., Limao, N., 2022. Trade Policy Uncertainty. Annual Review of Economics, Vol. 14, pp. 363-395.
Husted, L., Rogers, J., Sun, B., 2020. Monetary policy uncertainty. Journal of Monetary Economics, Vol. 115, Pp. 20-36
Jackson, L., Kevin, L. Owyang, M., 2018. The Nonlinear Effects of Uncertainty Shocks, Working Papers 2018-035. Federal Reserve Bank of St. Louis.
Jeanne, O., 1997. Are currency crises self-fulfilling? A test. Journal of International Economics, Vol. 43, No 3-4, pp. 263-286.
Jerow, S., Wolff, J., 2022. Fiscal policy and uncertainty. Journal of Economic Dynamics and Control, Vol. 145, 104559.
Jimenez, G., Ongena, S., Peydró, J.-L., Saurina, J., 2014. Hazardous times for monetary policy: What do twenty-three million bank loans say about the effects of monetary policy on credit risk-taking? Econometrica, No 82, pp. 463–505.
Jurado K., Ludvigson S., Ng S., 2015. Measuring Uncertainty. American Economic Review, No 105, pp. 1177-1216.
Kang, W., Ratti, R., Vespignani, J., 2020. Impact of global uncertainty on the global economy and large developed and developing economies. Applied Economics, Vol. 52, Issue 22.
Knight, F., 1921. Risk, Uncertainty, and Profit. New York: Houghton Mifflin.
Krugman, P., 1979. A Model of Balance-of-Payments Crises. Journal of Money, Credit and Banking, Vol. 11, No 3, pp. 311-25.
Leblang, D., Satyanath, S., 2008. Politically generated uncertainty and currency crises: Theory, tests, and forecasts. Journal of International Money and Finance, Vol. 27, No 3, pp. 480-497.
Londono, J., Ma, S., Wilson, B., 2021. The Global Transmission of Real Economic Uncertainty. International Finance Discussion Papers 1317. Washington: Board of Governors of the Federal Reserve System.
Lorenzoni, G., Werning, I., 2019. Slow Moving Debt Crises. American Economic Review, Vol. 109, No 9.
Masson, P.; Agenor, P.-R., 1996. The Mexican Peso Crisis: Overview and Analysis of Credibility Factors. IMF Working Paper No 1996/006.
Mathy, G., 2020. How much did uncertainty shocks matter in the Great Depression? Cliometrica, Journal of Historical Economics and Econometric History, Vol. 14, Issue 2, pp. 283-323.
McKinnon, R., Pill, H., 1995. Credible liberalizations and international capital flows: the “overborrowing syndrome.” In: Ito, T., Krueger, A.O. (eds.), Financial Deregulation and Integration in East Asia. Chicago: University of Chicago Press.
Meinen, P., Roehe, O., 2017. On measuring uncertainty and its impact on investment: Cross-country evidence from the euro area, European Economic Review, Vol. 92, pp. 161-179.
Miyao, R., 2004. Economic Fundamentals or Financial Panic? An Empirical Study on the Origins of the Asian Crisis. Discussion Paper Series 151. Research Institute for Economics & Business Administration, Kobe University.
Moramarco, G., 2023. Measuring Global Macroeconomic Uncertainty and Cross-Country Uncertainty Spillovers. Econometrics, Vol. 11, No 2.
Nguyen, T., 2022. Economic policy uncertainty: The probability and duration of economic recessions in major European Union countries. Research in International Business and Finance, Vol. 62, Issue C.
Obstfeld, M., 1986. Rational and self-fulfilling balance-of-payments crises. American Economic Review. Vol. 76, No 1, pp. 72-81.
Obstfeld, M., 1996. Models of currency crises with self-fulfilling features. European Economic Review, Vol. 40, Issues 3–5, pp. 1037-1047.
Prilepskiy, I. V., 2022. Postroenie indikatorov makroekonomicheskoy neopredelyonnosti dlya Rossii [Macroeconomic uncertainty indicators for Russia]. Voprosy Economiki, No 9, pp. 34-52.
Radelet, S., Sachs J., 1998. The East Asian financial crisis: Diagnosis, remedies, prospects. Brookings Papers on Economic Activity, No 1.
Reinhart, C., Rogoff, K., 2008. This time is Different: A Panoramic View of Eight Centuries of Financial Crises. NBER Working Paper 13882.
Richter, B., Zimmermann, K., 2019. The Profit-Credit Cycle. Available at <https://ssrn.com/abstract=3292166> or <http://dx.doi.org/10.2139/ssrn.3292166>
Sachs, J., Tornell, A., Velasco, A., 1996. The Mexican peso crisis: Sudden death or death foretold? Journal of International Economics, No 41, pp. 265-283.
Scherbina, A., Schlusche, B., 2014. Asset price bubbles: A survey. Quantitative Finance, No 14, pp. 589-604.
Smiech, S., Papiez, M., Rubaszek, M., Snarska, M., 2021. The Role of Oil Price Uncertainty Shocks on Oil-Exporting Countries. Energy Economics, Vol. 93.
Stangebyet, Z., 2020. Beliefs and long-maturity sovereign debt. Journal of International Economics, Vol. 127, 103381.
Stock, J., Watson, M., 2012. Disentangling the Channels of the 2007-2009 Recession. NBER Working Paper 18094.
Sufi., A., Taylor, A., 2021. Financial crises: A survey. NBER Working Papers 29155.
Suh, J.-H., 2001. Self-fulfilling feature of the currency crisis in Korea. The Korean Economic Review, Vol.17, No 1, pp. 25-40.
Tamborini, R., 2015. Heterogeneous Market Beliefs, Fundamentals and the Sovereign Debt Crisis in the Eurozone. Economica, Vol. 82, pp. 1153–1176.
Tarashev, N., 2004. Are speculative attacks triggered by sunspots? A new test. BIS Working Papers No 166.
Xiong, W., 2013. Bubbles, crises, and heterogeneous beliefs. NBER Working Paper 18905.
Notes
1 The international financial crisis of 2008-2009.
2 Calculated in PPP terms.
3 Together, these economies account for 97% of global GDP.
4 Was adopted in 2012 to implement the ECB’s stated objective of “taking any necessary measures to safeguard the euro.”
5 This refers in the first case to an accelerated (i.e., not explainable by fundamentals) increase in credit to non-financial companies or households, in the second case to an unjustified rise in the prices of certain financial assets (most often shares or real estate).
6 This situation arises when debt is small and/or long-term borrowing dominates its structure.
7 The sample comprises mainly developed countries, with emerging markets represented by Argentina, India, Mexico and a few smaller countries.
8 An overview of the different ways of constructing and using uncertainty indicators is provided by David, Veronesi (2022).
10 https://worlduncertaintyindex.com/
11 https://www.policyuncertainty.com/
12 Measurement method proposed by Caldara, Iacoviello (2022).

1.jpg)
