
Пороговые особенности в исторической эволюции экономики США: уместны ли параллели между рубежом 1930-х – 1940-х годов и современностью?
[To read the article in English, just switch to the English version of the website.]
Васильев Владимир Сергеевич — д.э.н., главный научный сотрудник Института США и Канады Российской академии наук (ИСКРАН).
ORCID: 0000-0003-3131-9500
Для цитирования: Васильев В.С. Пороговые особенности в исторической эволюции экономики США: уместны ли параллели между рубежом 1930-х – 1940-х годов и современностью // Современная мировая экономика. Том 1. 2023. № 2 (2).
Ключевые слова: экономический порог, Великая депрессия, Вторая мировая война, стагфляция, научно-техническая революция.
В основу статьи положен доклад, представленный на XXIV Ясинскую (Апрельскую) международную научную конференцию НИУ ВШЭ по проблемам развития экономики и общества, прошедшую 4–14 апреля 2023 г. в Москве.
Аннотация
На основе использования метода исторических аналогий анализируется ситуация, сложившаяся в американской экономике и обществе в начале 2020-х годов. Она характеризуется беспрецедентным сочетанием наиболее глубокого после окончания Второй мировой войны экономического кризиса, вызванного коронавирусной пандемией, и острейшими внутриполитическими потрясениями, повлекшими обсуждение в американском обществе перспектив к сползанию страны к гражданской междоусобице. Складывающаяся в США в третьем десятилетии XXI в. ситуация анализируется с представлением о приближении американского общества к пороговому периоду в их историко-экономической эволюции, который может ознаменовать собой коренную трансформацию алгоритма функционирования всех общественных сфер — от технико-экономической до духовно-ценностной. «Пороговые» закономерности и особенности развития американской экономики и общества основаны на скачкообразной форме их дальнейшего функционирования, которые могут «перебросить» США в фундаментально иное качественное измерение. В прошлом США уже проходили подобного рода порог в период 1929–1945 гг., который также подробно проанализирован как создающий эмпирический аналог для понимания особенностей прохождения «второго» порога.
Введение: качественные скачки в развитии экономических систем
В широкой исторической эволюции экономической системы США, как, впрочем, и любой крупной высокоразвитой экономики мира, можно выявить две основные модели. В рамках первой формы поступательное развитие экономической системы осуществляется сравнительно медленно в ходе длительного периода сравнительно устойчивых темпов экономического роста, предопределяющих плавное повышение «угла» траектории перехода от прежнего к новому научно-технологическому укладу. В рамках второй модели поступательное развитие экономической системы происходит скачкообразно, предопределяя крутую траекторию перехода от одного состояния социально-экономической системы к другому. В свою очередь крутая траектория перехода от исходного положения социально-экономической системы в качественно иное состояние фактически означает сравнительно быстрый по историческим меркам переход в иное пространственно-временное измерение, что предполагает глубокие преобразования качественного характера практически всех параметров социально-экономической и политической системы.
Современное моделирование скачкообразной формы перехода от прежнего к качественно новому измерению состояния социально-экономической системы имплицитно основано на предлагаемом нами представлении о существовании порога на траектории исторической эволюции общественной системы, который выступает в роли своеобразного барьера на пути ее последовательно-поступательного развития.
Порог в общественном развитии мы определяем как двухфазовый переход от исходного состояния социальной системы в ее фундаментально новое измерение, характеризуемое качественной трансформацией большинства параметров социально-экономического и политического развития. Первая фаза порогового состояния общественной системы — это период синхронного нарастания стагнационных явлений в ее развитии и характеризуется замедлением темпов экономического роста и научно-технического прогресса вплоть до наступления состояния длительного экономического кризиса и экономической депрессии, резким обострением политических противоречий вплоть до возникновения серьезного гражданского противостояния, фундаментальным сдвигом в системе ценностной ориентации общества, создающим ощущение наступающей коренной трансформации всей системы общественных связей и взаимоотношений.
Вторая фаза может быть охарактеризована как переход общества в сравнительно короткий период качественно нового состояния, окончание которого знаменует формирование системы принципиально новых устойчивых факторов поступательного общественного развития, основанных на качественно ином научно-технологическом укладе и новых пространственно-временных координатах. Преодоление стагнационной фазы, как правило, осуществляется скачкообразно, после чего социально-экономическая система выходит на принципиально новую траекторию своего развития в широком смысле этого слова.
В качестве конкретной иллюстрации существования порога и пороговых закономерностей в общественном развитии приводится интерпретационная модель особенностей и специфики развития США в период 1929–1945 гг., который и трактуется как период прохождения американским обществом порога общественного развития. Историческое развитие США в период с 1929 по 1945 гг. может быть представлено в виде двух взаимообусловленных фаз: 1) периода Великой депрессии 1929–1939 гг. и 2) периода подготовки и участия во Второй мировой войне с 1939-го по 1945 г. В течение 1929–1939 гг., в период Великой депрессии, ВВП США, измеряемый в текущих ценах, в ходе экономического кризиса 1929–1933 гг. сократился примерно на 45,0% — со 105 млрд долл. до 57,2 млрд долл., а затем медленно восстанавливался, и на уровень 1929 г. он вышел только в 1940 г., когда его величина составила 103,0 млрд долларов. После начала Второй мировой войны в сентябре 1939 г. США стали наращивать свои военные расходы, начав процесс постепенной конверсии гражданской экономики в военную, а вступление США в войну в декабре 1941 г. и создание полномасштабной военной экономики в конечном итоге привело к тому, что в 1945 г., т. е. на момент окончания Второй мировой войны, ВВП США достиг рекордной отметки в 228,0 млрд. долл., т. е. увеличился по сравнению с 1940 г. в беспрецедентные 2,2 раза (Bureau of Economic Analysis. Table 1.1.5). Модель развития экономики США в период 1929–1945 гг. отражена на рисунке 1.
Рисунок 1. Модель развития экономики США в период 1929–1945 гг. (динамика изменения ВВП в млрд долл.)

.
Источник: Bureau of Economic Analysis. Table 1.1.5.
Рисунок 1 дает наглядное представление о специфике и форме порога, который США преодолели в 1929–1945 гг. Великая депрессия и стагнация в динамике изменения ВВП однозначно указывают на наличие мощного барьера на пути поступательного развития экономической системы американского общества — первая фаза. А рост ВВП в период 1940–1945 гг. является наглядной иллюстрацией практической возможности для экономики совершить «скачок» в течение сравнительно короткого исторического отрезка времени, естественно, при радикальном изменении внешних и внутренних условий, каковым для США явилась Вторая мировая война — вторая фаза. Вместе с тем американский опыт преодоления порога в период 1929–1945 гг. демонстрирует ряд принципиально важных особенностей и свойств пороговой ситуации, в рамках которых происходит почти «алхимическая» метаморфоза количественных параметров в их фундаментально иное качественное состояние, что заняло 1930-е годы, «Новый курс» и выход на новый тип развития, который в марксистской теории назывался «государственно-монополистическим капитализмом», чему посвящено множество книг всех направлений.
Трактовка специфики общественного развития США в период 1929–1945 гг., развиваемая в данной статье, с позиций нашей пороговой теории является принципиально новой в социально-экономической литературе. Современные американские макроэкономические теории используют понятие «экономического порога» в весьма фрагментарной форме. Известные американские экономисты под влиянием мирового финансово-экономического кризиса 2007–2009 гг. открыто заговорили о том, что повышательная или нисходящая траектории экономического развития напрямую зависят и определяются наличием порогов (барьеров), предопределяющих степень эффективности глобализированной интеграции отдельных стран, которая в свою очередь самым непосредственным образом влияет на темпы экономического роста.
По мнению американских экономистов А. Косе, Э. Прасада и Э. Тейлора, в сфере глобальной финансовой интеграции «основная сложность заключается в том, что, по-видимому, существуют определенные “пороговые” уровни финансового и институционального развития, которых должна достичь экономика, прежде чем она сможет получить все косвенные выгоды и снизить риски либерализации своего счета операций с капиталом. С этой точки зрения становится понятным, почему промышленно развитые страны, которые обычно имеют лучшие институты, более стабильную макроэкономическую политику и более развитые финансовые рынки по сравнению с развивающимися странами, являются главными бенефициарами финансовой глобализации» (Kose A. et.al. 2009: 2). Пороги в финансовой системе, пройденные развитыми странами, особенно США, во многом отделяют их от массы развивающихся стран.
В свою очередь этот вывод базировался на более ранней работе данного авторского коллектива, в которой содержался вывод о том, что для успеха финансовой глобализации вообще должны быть созданы исходные пороговые условия и особенно выявлено «относительное значение различных пороговых условий» для последующего экономического развития страны (Kose A. et. al. 2010: 4345). С позиций более широкой перспективы можно сделать вывод о том, что преодоление экономического порога является важнейшим исходным условием устойчивости последующей траектории развития экономики и степени ее крутизны. Зафиксированные в XXI в. различия в степени успешности финансовой глобализации применительно к странам с различным уровнем социально-экономического развития свидетельствуют о том, что развитые страны (и это положение прежде всего относится к США) на прошлых стадиях исторической эволюции своих экономических систем уже успешно преодолели этот порог, что, собственно говоря, и определяет их доминирующие позиции в современной мировой экономике.
Экономическая политика Ф.Д. Рузвельта: от «Доктора “Новый курс”» к «Доктору “Выиграть войну”»
В конце декабря 1943 г. на пресс-конференции президент Ф.Д. Рузвельт высказал свое принципиальное отношение к той смене базовой направленности социально-экономической политики своей администрации, которая произошла после начала Второй мировой войны. Ф.Д. Рузвельт дал однозначно понять, что с практикой и идеологией «Нового курса», провозглашение которого и стало решающим фактором его победы на президентских выборах 1932 и 1936 гг., покончено, и им на смену пришла практика и идеология Доктора «Выиграть войну», которая, вполне возможно, будет определять дальнейшее социально-экономическое и политическое развитие США и после окончания Второй мировой войны.
Прибегнув к своему излюбленному методу диагностирования социально-экономических проблем американского общества с медицинской точки зрения, 32-й президент США сравнил Америку 1932–1933 гг. с «больным человеком», который страдал «внутренними болезнями». В тот период Америке потребовался доктор, и он пришел в виде Доктора «Новый курс». Это был доктор-терапевт, который в течение долгих 6–7 лет «лечил» американское общество, но после прохождения курса лечения в конце концов «недуги были излечены» (The American Presidency Project 1943). Однако в декабре 1941 г., с нападением Японии на американскую военно-морскую базу Пирл-Харбор (Гавайи) и объявлением ей США 8 декабря войны, продолжал далее Рузвельт, «пациент Америка» попал в очень тяжелую аварию — он «сломал бедро, сломал ногу в двух-трех местах, сломал запястье и руку, несколько ребер». И вот тогда на смену прежнему доктору-терапевту пришел новый доктор — доктор-хирург. Прежний Доктор «Новый курс» ничего не знал о хирургии, о ногах и руках. Прежний доктор «много знал о внутренних заболеваниях, но ничего о хирургии. Поэтому он попросил своего напарника, хирурга-ортопеда, Доктора “Выиграть Войну”, позаботиться об этом парне, который попал в аварию. И в результате пациент снова встает на ноги. Он отказался от своих костылей. Он еще не совсем здоров, и не выздоровеет, пока не выиграет войну» (The American Presidency Project 1943).
В ходе своего выступления Рузвельт остановился на двух принципиальных моментах. Во-первых, он подчеркнул, что первоочередным приоритетом является «стимулирование роста экономики, что приведет к большей безопасности, большему количеству рабочих мест, большим возможностям для отдыха, большему количеству образования, большему здоровью, лучшему жилью для всех наших граждан, чтобы условия 1932-го и начала 1933 года больше не вернулись». Во-вторых, «Новый курс» — это была «программа для решения проблем 1933 г. Теперь, со временем, ей должна прийти на смену новая программа, кто бы ни руководил правительством. Мы не говорим о программе 1933 г. Мы выполнили почти все пункты программы 1933 г., но это не исключает и не делает невозможной или ненужной другую программу, когда придет другое время» (The American Presidency Project 1943).
К концу 1930-х годов стало очевидным, что реформы «Нового курса» не в состоянии обеспечить поступательного развития американской экономики — более того, они стали важнейшей преградой на пути поступательного экономического роста. В мае 1937 г. экономика свалилась в рецессию, которая продолжалась в течение года; низшая точка спада была зафиксирована в июне 1938 г. (NBER). В американской печати того времени она тут же стала именоваться «рецессией Рузвельта» и стала третьим по глубине падения экономическим кризисом в первые четыре десятилетия ХХ в. Падение реального ВВП составило 11,0%, безработица взлетела до уровня 19,0%, промышленное производство сократилось на 32% (Irwin 2011). Современные интерпретации глубинных причин рецессии 1937–1938 гг., которые относят ее к разновидности исторических тайн, связывают их не столько с ограничительной фискальной и монетарной политикой, сколько с тем, что в США в тот период — с конца 1937 г. по середину 1938 г. — полностью прекратился приток золота из Европы, который возобновился только осенью 1938 г. после присоединения Судетской области Чехословакии к Германии (Irwin 2011).
Окончательную точку в социальном реформаторстве «Нового курса» поставили промежуточные выборы, состоявшиеся осенью 1938 г., которые кончились поражением Демократической партии, потерявшей 8 мест в Сенате и рекордные 72 места в Палате представителей, хотя и сохранившей контроль над обеими палатами Конгресса США. Как прямое следствие итогов промежуточных выборов 1938-го, в 1939 г. Рузвельт «впервые за все время своего президентства не направил в Конгресс ни одного нового реформаторского законопроекта» (Busch 2006).
Фундаментальную причину «остановки» реформаторских начинаний «Нового курса» следует искать в его общей направленности. Стагнирующая американская экономика 1930-х годов не оставляла для Рузвельта и его сторонников социально-экономических реформ никаких других форм расширения социальных программ и присутствия государства в экономике, кроме как широкого использования механизма перераспределения национального дохода — естественно, от наиболее состоятельных слоев американского общества в пользу «бедных и униженных». Первый шаг в этом направлении был сделан в августе 1935 г. с принятием Закона о социальном обеспечении, которое частично стало финансироваться за счет специального налога на богатых, установленного на уровне 75% на доходы налогоплательщиков с годовыми доходами свыше 5 млн долл. (Leuchtenburg 1963: 154). Собственно говоря, в окружении Рузвельта рецессия 1937–1938 гг. и была воспринята как «месть и как предупреждение Уолл-Стрит» в отношении дальнейшей возможной политики «социализации» американского общества.
В конце 1930-х годов Рузвельт и его администрация оказались на историческом распутье: продолжение реформаторских начинаний «Нового курса» объективно вело к «классовой войне» в американском обществе, а смена внутриполитического вектора на внешнеполитический означало постепенное втягивание США во Вторую мировую войну. Используя образную терминологию самого Рузвельта, Доктор «Выиграть войну» прочно занял место Доктора «Новый курс»: речь шла о том, одержит ли Рузвельт победу в войне внутри или же в войне за пределами США. В начале 1940-х годов Рузвельт однозначно и бесповоротно сделал выбор в пользу постепенного втягивания США в очередной мировой военный конфликт, не без основания считая, что в этой войне США имеют стратегическое преимущество в использовании и наращивании своих «арсеналов демократии».
Вторая фаза началась в 1940 фин. г. с увеличения по сравнению с 1939 фин. г. военных расходов США с 1,4 млрд долл. до 1,8 млрд долл. (в текущих ценах), т. е. примерно на 30,0%, а в 1941 фин. г. — в 3,6 раза по сравнению с 1940 фин. г. , тогда они достигли 6,4 млрд долл. Вступление США в войну в декабре 1941 г. привело к скачкообразному увеличению военных расходов, которые в 1945 фин. г. достигли своего максимума и составили почти 83,0 млрд долл. (U.S. expenditures… ). В относительном измерении в конце 1930-х годов военные расходы США не превышали 2,0% ВВП, однако, в конце Второй мировой войны достигли 37,0% ВВП. В приоритетах федерального правительства военные расходы увеличились с 18,0% в 1940 фин. г. до 90,0% в 1945 фин. г. (Budget of the U.S. Government. Historical Tables. Table 6.1). Наращивание военной мощи США началось задолго до официального вступления США во Вторую мировую войну и происходило по ряду направлений. 16 мая 1940 г. в своем обращении к Конгрессу по поводу необходимости резкого увеличения расходов на оборону Рузвельт в прямом смысле этого слова шокировал американских законодателей планом создания мощных военно-воздушных сил путем доведения ежегодного производства самолетов до 50 тыс. единиц (The American Presidency Project 1940). После падения Франции и поражения британо-французских войск под Дюнкерком в США началась мобилизация (призыв мирного времени) в вооруженные силы США, в результате чего она была увеличена с 190 тыс. военнослужащих в 1939 г. до 269 тыс. человек в 1940 г. К концу Второй мировой войны численность американских вооруженных сил была доведена до 8,3 млн человек (The National WWI Museum. Research Starters… .).
11 марта 1941 г. Рузвельт подписал Закон о ленд-лизе, который наделил администрацию правом предоставлять или давать в аренду «любой стране военное снаряжение, которое является важным с точки зрения обеспечения жизненно важных интересов обороны США». Фактически Закон о ленд-лизе, распространяемый в тот момент принятия на Великобританию, означал de facto вступление США во Вторую мировую войну при формальном соблюдении статуса нейтральной державы (National Archives). И, наконец, 9 октября 1941 г. Ф. Рузвельт поручил В. Бушу, директору созданного в конце июня 1941 г. указом президента Управления научных исследований и разработок, начать работы по созданию атомной бомбы в рамках сверхсекретного научно-технического проекта, получившего название «Манхэттенского проекта», несмотря на то, что в это время США «всё еще формально оставались нейтральной державой, однако, Рузвельт стал первым национальным лидером, который направил ресурсы своей страны на создание ядерного устройства. Тем самым он также решительно изменил характер отношений между американским правительством и американской наукой, и это культурное изменение сохраняется и по сей день» (The National WWII Museum. FDR Approves … .).
О драматической «конверсии» стратегии и тактики «Нового курса», которые могут быть охарактеризованы как «социально-экономическое кейнсианство» 1930-х годов к масштабному «военному кейнсианству» первой половины 1940-х годов, дает исчерпывающее представление карикатура 1943 г., получившая широкое хождение в США. Социально-экономические реформы «Нового курса» были представлены в качестве «отслужившей свой век» загнанной лошади, которую отправили пастись на пастбище, в то время как военная экономика была изображена мощным средством поступательного развития Америки.
Перевод американской экономики в годы войны на принципиально новую научно-техническую базу позволил США произвести в период 1940–1945 гг. почти 300 тыс. самолетов, свыше 1,5 тыс. военных кораблей и подводных лодок, 88 тыс. танков, 634 тыс. джипов, почти 6 тыс. морских судов, 6,5 млн винтовок и других видов стрелкового вооружения (Statesman & Commander in Chief … .). Военная экономика США самым непосредственным образом способствовала переходу американский экономики на новый технологический уклад, основанный на том, что современная наука стала реальной производительной силой. Как справедливо указали в этом плане отечественные исследователи Л. Григорьев и А. Астапович, «Рузвельт, видимо, первым в массовом порядке ввел интеллектуалов в управление страной, и они не только продержались два срока президентства, но и создали прецедент, который нередко использовался в других странах и случаях» (Григорьев, Астапович 2021: 117).
В июле 1945 г. В. Буш сформулировал этот тезис в докладе на имя президента США «Наука — безграничные горизонты» (Bush 1945). 16 июля 1945 г. США провели первое в мире успешное испытание атомной бомбы в пустыне Аламагордо (шт. Нью-Мексико), знаменуя тем самым финальную фазу прохождения экономического порога. Создание фундаментально «эзотерических» технологий на основе овладения невиданными ранее видами энергии, которые скорее могут быть отнесены к области научно-фантастических произведений, также следует считать имманентным свойством пороговых закономерностей в развитии науки и техники, в рамках которых качественный скачок в научно-техническом прогрессе является симметричной функцией экономического скачка.
2020-е годы: стагфляция — первая фаза порогового состояния американского общества
Мы полагаем, что в начале третьего десятилетия XXI в. США вступили в сравнительно продолжительный период экономической стагнации, которая представляет собой сочетание внешних шоков и внутренних структурных дисбалансов и образует первую фазу «порога». Коронавирусная пандемия, обрушившаяся на США в начале 2020 г., быстро привела к тому, что уже в первом квартале реальный ВВП, измеряемый в постоянных ценах 2017 г., сократился на 4,6%, однако подлинный шок американская экономика испытала во втором квартале, когда в США был официально введен карантинный режим «закрытия экономики», в результате чего реальный ВВП сократился на 29,9% (Bureau of Economic Analysis. Table 1.1.1.), и это поквартальное падение явилось самым глубоким за последние 70 лет со времен Великой депрессии (Economic Report of the President 2022: 100). И, несмотря на то, что в третьем квартале реальный ВВП вырос на беспрецедентные 35,3%, общее снижение ВВП в 2020 г. составило рекордные 2,8%, что явилось самым глубоким падением реального ВВП после 1946 г., когда оно достигло 11,6% (Bureau of Economic Analysis. Table 1.1.1.).
Призрак Великой депрессии в сочетании президентскими выборами, которые президент-республиканец Д. Трамп хотел выиграть «любой ценой», привели к тому, что в течение 2020 г. и в начале 2021 г., уже при демократической администрации Дж. Байдена, федеральное правительство ассигновало беспрецедентный объем бюджетных средств для преодоления экономического кризиса, вызванного коронавирусной пандемией. Суммарный объем средств в общей сложности достиг 5,4 трлн долл. Перечень принятых законов, их характеристика и величины ассигнованных средств приводятся в таблице 1.
Таблица 1. Фискальные меры федерального правительства США по преодолению экономического кризиса 2020–2021 гг.
|
Принятое законодательство |
Общая характеристика мер поддержки экономики |
Сумма выделенных средств, в млрд долл. |
|
Закон о дополнительных ассигнованиях по борьбе с коронавирусной пандемией. 6 марта 2020 г. |
Финансирование разработки противовирусных вакцин и их тестирование |
8,3 |
|
Закон о первоочередной помощи семьям по борьбе с коронавирусной пандемией. 18 марта 2020 г. |
Финансирование программ медицинской и продовольственной помощи американским семьям |
192,0 |
|
Закон о помощи, поддержке и экономической безопасности в связи с коронавирусной пандемией. 27 марта 2020 г. |
Финансовая компенсация потерь доходов семей, безработных, малых и средних фирм, вызванных коронавирусной пандемией |
1756,0 |
|
Закон о защите заработной платы и улучшении медицинского обслуживания. 24 апреля 2020 г. |
Дополнительное финансирование Закона о помощи, поддержке и экономической безопасности в связи с коронавирусной пандемией |
484,0 |
|
Исполнительные указы президента Д. Трампа |
Дополнительные выплаты безработным, должникам по студенческим займам, арендаторам жилья и домовладельцам |
174,0 |
|
Дополнительные ассигнования по борьбе с коронавирусной пандемией и оказанию помощи населению. 27 декабря 2020 г. |
Помощь безработным, финансирование программ создания противовирусных вакцин, поддержка транспорта и отрасли рекреационных услуг |
915,0 |
|
Американский план спасения 2021 г. 27 марта 2021 г. (администрация Дж. Байдена). |
Финансовая поддержка домовладений, безработных, местных и штатных органов власти, бизнеса и системы здравоохранения |
1821,0 |
|
Всего |
5350,3 |
|
Источник: Moody’s Analytics 2022: 5.
Колоссальные бюджетные вливания для поддержания на плаву и возможно даже для сравнительно быстрого вывода ее на траекторию устойчивого экономического роста, однако, привели к тому, что в марте 2021 г. американская экономика «пробила» планку в 2,0% ежегодного роста инфляции, измеряемой индексом потребительских цен (ИПЦ), установленную ФРС США в январе 2012 г. (Board of Governors of the Federal Reserve System 2020). На протяжении последующих 15 месяцев в США продолжался разгон инфляции, которая достигла максимального значения в 9,1% (в годовом измерении) в июне 2022 г. — самый высокий показатель с начала 1980-х годов (Monthly 12-month Inflation Rate…). Основная причина инфляционного «перегрева» американской экономики состояла (и состоит) в том, что подавляющая сумма средств из общего объема фискальной поддержки экономики в сумме 5,4 трлн долл. пошла на поддержку текущего потребления американского населения. Осознав в начале 2022 г., что инфляционные процессы практически полностью вышли из-под контроля монетарного регулятора, ФРС начала агрессивно поднимать базовую ставку рефинансирования, которая была увеличена с марта 2022 г. по июль 2023 г. с исходных 0–0,25% до отметки 5,25–5,50% (Board of Governors of the Federal Reserve System. Policy Tools. Open Market Operations).
Воздействие мощной интервенционистской политики ФРС не замедлило сказаться на экономике: в первом и втором кварталах 2022 г. темпы падения реального ВВП составили 1,6% и 0,6% соответственно (Bureau of Economic Analysis. Table 1.1.1). Стало очевидным, что в своей политике обуздания инфляции ФРС балансирует между мягкой и жесткой «посадкой» американской экономики, т.е. выбирает между неглубокой и непродолжительной рецессией и масштабным экономическим кризисом (Verbrugge, Saeed 2023: 30-31), что, впрочем, напрямую связано и проистекает из принципиальной политической установки нынешнего руководства ФРС о необходимости вернуться к годовому инфляционному ориентиру в 2,0% (Board of Governors of the Federal Reserve System 2023: 40). Низкие темпы роста в США в 2022–2023 годы проходят на фоне маневров ФРС между снижением инфляции и предотвращением рецессии.
В этом плане американские аналитики указывают, что социально-экономические условия в американской экономике радикально отличаются от ситуации второго десятилетия текущего столетия, и что наиболее оптимальным в настоящее время является инфляционный ориентир, равный 3,0% (Verbrugge, Zaman 2023: 7). К концу лета 2023 г. инфляция в США сократилась до 3,7 % (3,0%), но, тем не менее, ФРС на основе разницы в ценовых котировках долгосрочных и краткосрочных ценных бумаг Министерства финансов США прогнозировала вероятность наступления рецессии в США в период до сентября 2024 г. как составляющую почти 57,0%, что было самым высоким значением после начала 1980-х годов. Прогноз ФРС о вероятности наступления рецессии в США в период до сентября 2024 г. приводится на рисунке 2.
Рисунок 2. Прогностическая оценка ФРС США вероятности наступления рецессии в экономике США в период до сентября 2024 г., в %.
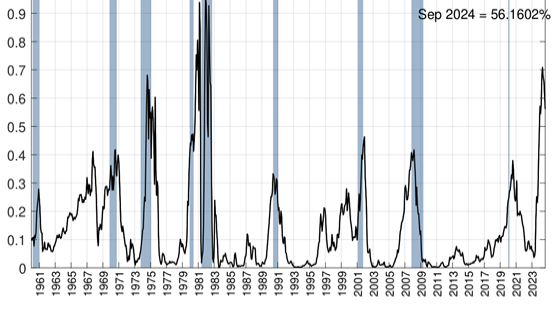
Источник: Probability of US Recession… .
Инфляция в современной американской экономике играет важную роль в первой фазе порогового барьера, которая препятствует дальнейшему поступательному развитию экономики США, предопределяя стагнационный характер ее современного состояния. Она в немалой степени подпитывается также резко возросшей в 2020 г. монетарной базой экономики США, которая в расчете на агрегированный показатель М2 составляла на август 2023 г. 20,9 трлн долл. (Board of Governors of the Federal Reserve System, September 26, 2023. Table 1), т.е. была сопоставима с размерами ВВП, а также балансовым счетом ФРС, который на март 2020 г. составлял 4,7 трлн долл., но был быстро увеличен почти в два раза к концу 2020 г. и достиг отметки в 8,1 трлн долл. к концу сентября 2023 г. (Board of Governors of the Federal Reserve System, September 28, 2023). В этом плане можно высказать предположение, что в настоящее время США по сути остались без наработанных за весь период после Второй мировой войны привычных рычагов монетарной политики, свидетельством чего является политика ФРС по поднятию процентных ставок на фоне отчетливо проявивших себя рецессионных явлений, как это имело место в первой половине 2022 г.
В относительном выражении фискальные вливания в размере 5,4 трлн долл. в течение 2020–2022 фин. гг., достигшие 23,4% ВВП, представляют собой вклад в увеличении пирамиды валового долга федерального правительства (Economic Report of the President 2022: 50), которая к началу октября 2023 г. достигла 33,5 трлн долл. (U.S. Department of Treasury). Стремительно растущая пирамида валового долга федерального правительства является видимым символом мощного барьера на пути дальнейшего развития американской экономики. Экономический кризис 2020 г. и последующие меры администрации Дж. Байдена по его преодолению необратимым образом разбалансировали системы федеральных финансов США, при которой хронические и все увеличивающиеся дефициты федерального бюджета, составляющие ежегодно по меньшей мере 1,5 трлн долл., стали их «новой нормальностью». Согласно прогнозам Бюджетного управления Конгресса США (БУК), на период до 2033 фин. г., в 2030 фин. г. бюджетные дефициты вырастут до 2,0 трлн долл., а к 2033 фин. г. вплотную приблизятся к 3,0 трлн долл. (CBO. June 2023: 5).
Выход на подобного рода траекторию прогрессирующего роста бюджетных дефицитов также означает, что при наступлении очередного экономического потрясения система федеральных финансов в еще большей степени будет создавать дополнительную бюджетную нагрузку на экономику США, предопределяя как тенденцию к переходу на устойчивые, всё более высокие абсолютно и относительно уровни бюджетных дефицитов, так и рост пирамиды валового долга федерального правительства, что в свою очередь будет означать все большее замедление темпов экономического роста вплоть до состояния хронической стагнации. В частности, согласно расчетам БУК, уже в настоящее время американская экономика несет ежегодные потери в объемах производимого ВВП в пределах 500,0-600,0 млрд долл. (CBO. June 2023: 5). Однако при любых вариациях в размерах бюджетных дефицитов в среднесрочной перспективе в расчете на 10 лет, валовой долг федерального правительства будет расти большими темпами по сравнению с темпами роста экономики, и к 2033 фин. г. в абсолютном выражении он может превысить 52,0 трлн долл. (CBO. May 2023: 7). В результате, соотношение валового долга федерального правительства и ВВП может увеличиться с нынешнего уровня, равного 123,7% (по состоянию на 2023 фин. г.), до отметки в 133,3% в 2033 фин. г. [Рассчитано по: (CBO. June 2023: 2,5)].
Рост долговой нагрузки на экономику однозначно означает замедление темпов экономического роста по причине: 1) вытеснения инвестиций в частный сектор экономики государственными заимствованиями; 2) более высоких процентных ставок для повышения привлекательности государственных ценных бумаг; 3) более высоких налогов, необходимых для частичной компенсации роста бюджетных дефицитов и пропорционального увеличения пирамиды валового долга, и 4) роста инфляции (Salmon J. 2021: 489-490). Однако самым важным фактором депрессивного воздействия пирамиды долга федерального правительства на экономическое развитие является наличие «порогов» в соотношении валового долга и ВВП, преодоление которых резко (нелинейно) замедляет темпы роста ВВП. В настоящее время такого рода порогом считается показатель соотношения валового долга и ВВП, равного 100%, преодоление которого резко усиливает «негативное воздействие обремененной долгами экономики на потенциал ее экономического роста», что может обернуться экономическими потерями, измеряемыми триллионами долларов (De Rugy, Salmon 2020: 9-10).
Стремительный рост пирамиды долга федерального правительства ведет к скачкообразному росту расходов по статье обслуживание долга (выплачиваемые нетто-расходы), что резко сужает возможности США инвестировать в реальный сектор американской экономики. Фактически уже в настоящее время обслуживание долга федерального правительства достигло размеров, вполне сопоставимых с прямыми военными расходами. Согласно расчетным оценкам БУК, в текущем 2023 фин. г. расходы на обслуживание федерального долга выйдут на рекордные 655 млрд долл. (2,6% ВВП), в 2027 фин. г. превысят 900,0 млрд долл., а в 2033 фин. г. могут составить беспрецедентные 1,4 трлн долл. (3,9% ВВП) [Рассчитано по: (CBO. The 2023 Long-Term … : 7)].
Кризисные явления в системе федеральных финансов значительно повышают риски наступления череды непродолжительных рецессий и даже глубокого финансово-экономического кризиса, что объективно ведет к замедлению темпов экономического роста. Авторские расчеты показывают, что в период с 2000-го по 2009 г. среднегодовые темпы роста американской экономики (в постоянных ценах 2017 г.) составили 1,94%, в период с 2010-го по 2019 г. — 2,24% [Рассчитано по: (Bureau of Economic Analysis. Table 1.1.1)]. Улучшение показателей роста реального ВВП во втором десятилетии текущего столетия объясняется тем, что это был период самого длительного экономического подъема в США за все время после окончания Второй мировой войны, продолжавшегося 128 месяцев, а в то время как в первом десятилетии XXI в. США пережили две экономические рецессии, в результате продолжительность фазы подъема в этот период составила всего 72 месяца (CBPP. Chart Book 2023).
В течение первых трех лет третьего десятилетия с 2020-го по 2022 г. темпы роста реального ВВП снизились до 1,67% [Рассчитано по: (Bureau of Economic Analysis. Table 1.1.1)]. Согласно прогнозам The Conference Board, в 2023 г. темпы роста реального ВВП США возрастут до 2,2%, однако, в 2024 г. опустятся до 0,8% (The Conference Board… 2023). ФРС также прогнозирует, что в третьем десятилетии текущего столетия темпы роста реального ВВП составят 1,8% (Board of Governors… , Summary of Economic Projections: 2).
Таким образом можно сделать прогностический вывод о том, что рост долговой нагрузки на американскую экономику в начале 2020-х годов уже обернулся заметным замедлением темпов экономического роста. Рост долговой нагрузки на экономику, как показывает американский опыт в 2020–2023 гг., вносит серьезные искажающие моменты в привычные фазы экономического цикла, что объективно усиливает вероятность того, что американская экономика может «проскочить из позднего подъема через полный набор фаз цикла в новый спад инвестиций при высокой инфляции и антиинфляционных мерах» ФРС (Григорьев 2023: 26). Эти перепады в привычных фазах экономического цикла являются самым верным симптомом воспроизводства барьерной ситуации, сложившейся в экономике США на рубеже 1930-х–1940-х годов. Другим важнейшим барьерным симптомом стала дилемма противостояния либо «внутреннему американскому терроризму», либо геополитическим противникам в лице России и Китая.
Стратегический выбор США: «внутренние террористы» v. внешние геополитические противники
События 6 января 2021 г., вошедшие в анналы американской истории как «штурм Капитолия», коренным образом изменили внутриполитическую ситуацию в США. Подобно тому, как в 1860-е годы американское общество оказалось расколотым на северные и на южные штаты, последние из которых образовали в 1861–1865 гг. союз тринадцати мятежных штатов, известных как Конфедерация, так и в настоящее время США разделены на «красные» (прореспубликанские) и «синие» (продемократические) штаты. Показательно, что вероятность новой Гражданской войны США всерьез обсуждается в Соединенных Штатах и сегодня – даже в таком влиятельном академическом журнале как «Science», издаваемом Американской ассоциацией содействия развитию науки. При этом издание отталкивалось от публикуемых время от времени опросов общественного мнения, согласно которому свыше 40,0% респондентов считали вероятным начало второй Гражданской войны в США после или в канун президентских выборов 2024 г. При этом основным фактором ее генезиса американские ученые были склонны считать резко возросший уровень продаж огнестрельного оружия в Америке, в результате чего число убийств от огнестрельных ранений в США в период с 2010 по 2020 гг. выросло на 43,0% (Ortega 2022: 357).
Как и в XIX в., в настоящее время важнейшим идеологическим фактором политической поляризации американского общества являются стереотипы сознания белого большинства, согласно которым «примерно двое из пяти взрослых согласны с постулатом белой националистической “теории великой замены” или с идеей о том, что белых избирателей по рождению заменяют иммигранты для получения преимуществ в ходе выборных кампаний» (Ortega 2022: 357).
В сугубо экономическом отношении внутриполитическую ситуацию в США могут взорвать планы, получившие официальное одобрение со стороны Демократической партии США, о необходимости выплаты исторических репараций афроамериканскому населению за 90 лет рабства и последующие 100 с лишним лет политики сегрегации и ущемления в правах. Общая сумма этих репараций оценивается от 12,0 до 13,0 трлн долл. (в долларах 2018 г.) (Jarvis 2021: 4), и совершенно очевидно, что речь идет о фундаментальной трансформации хозяйственного механизма американской экономики, в рамках которой основным приоритетом станут отношения перераспределения доходов и накопленных богатств, а не их расширенное производство.
Наиболее тревожным аспектом нынешней «пороговой» ситуации в США, несмотря на наличие ядерного оружия, которое потенциально исключает использование театров мировых войн для решения всего спектра острейших внутренних проблем, является то, что перед американскими правящими кругами стоит не проблема стратегии и тактики «конкуренции великих держав» и перестановки фигур на «великой шахматной геополитической доске», а дилемма формы ведения войны — экстравертной (во внешнем мире) или интравертной (внутри страны). Осознание этой дилеммы четко «читается» в планах администрации Дж. Байдена по резкому увеличению прямых военных расходов США, которые должны возрасти в ближайшем обозримом будущем до среднегодового уровня 900,0 млрд долл. (Budget of the U.S. Government. Fiscal Year 2024: 138), что является самым высоким показателем за всю историю США после Второй мировой войны.
Мы считаем совершенно очевидным, что добиться оптимального решения проблемы соотношения приоритетов внутреннего «тыла» и внешнего «фронта» в условиях растущих ограничений финансово-экономического плана для поступательного развития американского общества представляется невозможным, поэтому кризис и противоречия политической системы американского общества будут только нарастать объективно требуя прихода сильного национального лидера, каким в свое время явился Ф.Д. Рузвельт, который сумел провести Америку через две фазы порога в 1939–1945 гг.
Заключение: на горизонте новые революционные технологии?
В качестве обязательного элемента «пороговая» ситуация в развитии общества и экономики предполагает развитие прорывных технологий, предполагающих, в том числе, овладение новыми формами энергии и видами технологий, способных кардинально изменить геополитическую расстановку сил. После 1945 г. это было овладение атомной энергией и создание ядерного оружия. Есть свидетельства того, что попытки развития подобных прорывных технологий предпринимаются и сейчас. В частности, в настоящее время американские физики активно разрабатывают теории и ищут возможности экспериментального использования гравитационных волн с целью овладения космическими источниками энергии, которые можно применить и в создании новых видов летательных (антигравитационных) технологий (Baker Jr., Baker 2016). С учетом этих и других исследований американских астрофизиков, нельзя исключать, что так же, как и в 1942 г., в США в настоящее время может быть организован сверхсекретный научно-исследовательский проект — например, по овладению космическими энергиями и созданию новых видов летательных технологий.
Косвенным свидетельством правомерности проведения подобного рода исторических аналогий является организация в 2021 г. в рамках федерального правительства межведомственной группы по изучению необычных летательных аппаратов, о результатах работы которой, в частности, Конгресс США и американская общественность были проинформированы в январе 2023 г. в докладе директора национальной разведки США. В этом докладе подчеркивалось, что можно считать твердо установленным фактом, что эти летательные аппараты «по-видимому, демонстрируют необычные летные характеристики или траектории движения» (Office of the Director of National Intelligence 2022: 5), недоступные даже для самых передовых образцов современной земной технологии. Успешная реализация подобного «Манхэттенского проекта» XXI в. может быть призвана в окончательной форме утвердить претензии США на планетарное господство.
Библиография
Григорьев Л., Астапович А. От Великой Депрессии к системным реформам. США между двумя мировыми войнами // Россия в глобальной политике. Том 19. № 1. Январь-февраль 2021. С. 104-119.
Григорьев Л.М. Влияние шоков 2020–2023 годов на деловой цикл // Современная мировая экономика. Том 1. № 1 (1). Январь—март 2023. С. 8-32.
Baker Jr. R., Baker B. Application of High-Frequency Gravitational Waves to the Cataclysmic Event of Our First Encounter with Intelligent Extraterrestrial Beings // Journal of Applied Mathematics and Physics. January 2016, pp. 110-129. Режим доступа: http://dx.doi.org/10.4236/jamp.2016.41015.
Board of Governors of the Federal Reserve System. Summary of Economic Projections, June 14, 2023. 17 pp. Режим доступа: https://www.federalreserve.gov/monetarypolicy/fomcprojtabl20230614.pdf.
Board of Governors of the Federal Reserve System. Federal Reserve Balance Sheet: Factors Affecting Reserve Balances – H.4.1. September 28, 2023. Режим доступа: https://www.federalreserve.gov/releases/h41/20230928/
Board of Governors of the Federal Reserve System. Monetary Policy Report. June 16, 2023. iii + 65 pp. Режим доступа: https://www.federalreserve.gov/monetarypolicy/2023-06-mpr-summary.pdf.
Board of Governors of the Federal Reserve System. Money Stock Measures — H.6, September 26, 2023. Режим доступа: https://www.federalreserve.gov/releases/h6/current/default.htm.
Board of Governors of the Federal Reserve System. Policy Tools. Open Market Operations. Режим доступа: https://www.federalreserve.gov/monetarypolicy/openmarket.htm.
Board of Governors of the Federal Reserve System. Why does the Federal Reserve aim for inflation of 2 percent over the longer run? August 27, 2020. Режим доступа: https://www.federalreserve.gov/faqs/economy_14400.htm.
Budget of the U.S. Government. Fiscal Year 2024. Wash.: USGPO, 2023, ii + 176 pp.
Budget of the U.S. Government. FY 2024. Historical Tables. Table 6.1 – Composition of Outlays: 1940–2028. Режим доступа: https://www.whitehouse.gov/omb/budget/historical-tables/
Bureau of Economic Analysis. National Data. National Income and Product Accounts. Table 1.1.1. Percent Change From Preceding Period in Real Gross Domestic Product. Режим доступа: https://apps.bea.gov/iTable/?
Bureau of Economic Analysis. National Data. National Income and Product Accounts. Table 1.1.5. Gross Domestic Product. Режим доступа: https://apps.bea.gov/iTable/
Busch A. The New Deal Comes to a Screeching Halt in 1938. Ashbrook Center. 2006. May 1. Режим доступа: https://ashbrook.org/viewpoint/oped-busch-06-1938/
Bush V. Science The Endless Frontier. A Report to the President by Vannevar Bush, Director of the Office of Scientific Research and Development, July 1945. Wash.: NSF, 2020, xvii + 220 pp.
CBO. An Update to the Budget Outlook. May 2023. iv + 18 pp. Режим доступа: https://www.cbo.gov/publication/59096.pdf.
CBO. Automatic Stabilizers in the Federal Budget: 2023 to 2033. June 2023. 8 pp. Режим доступа: https://www.cbo.gov/publication/59114.pdf.
CBO. The Long-Term Budget Outlook. June 2023. iv + 57 pp. Режим доступа: https://www.cbo.gov/publication/59014.pdf.
CBPP. Chart Book: Tracking the Post-Great Recession Economy. May 27, 2023. Режим доступа: https://www.cbpp.org/research/economy/tracking-the-post-great-recession-economy.
De Rugy V., Salmon J. Debt and Growth: A Decade of Studies. Mercatus Center at George Mason University, Policy Brief, April 2020, 12 pp.
Economic Report of the President. April 2022. Wash.: USGPO, 2022, iii + 427 pp.
Irwin D. What caused the recession of 1937-38? // VOXEU/CERP, 11 Sep 2011. Режим доступа: https://cepr.org/voxeu/columns/what-caused-recession-1937-38.
Jarvis J. After Reparations Study Suggests $151 Million for Each African American, Experts Say Money Alone Isn’t Enough. 2/22/2021. 24 pp. Режим доступа: https://docs.house.gov/meetings/JU/JU10/20210217/111198/HHRG-117-JU10-20210217-SD003.pdf.
Kose A., Prasad E., Rogoff K. and Wei Sh.- J. Financial Globalization and Economic Policies // Handbook of Development Economics. Vol. 5 / Rodrik D. and Rosenzweig M. (Eds.).2010. The Netherlands: North-Holland, pp. 4283-4362. Режим доступа: Doi 10.1016/B978-0-444-52944-2.00003-3.
Kose A., Prasad E., Taylor A. Thresholds in the Process of International Financial Integration. December 2009. The World Bank. Policy Research Working Paper 5149. i + 41 pp. Режим доступа: https://elibrary.worldbank.org/doi/abs/10.1596/1813-9450-5149.pdf.
Leuchtenburg W. Franklin D.Roosevelt and the New Deal, 1932-40. N.Y.: Harper & Row, 1963, xvii + 393 pp.
Monthly 12-month inflation rate in the United States from May 2020 to May 2023 // Statista, Jun 19, 2023. Режим доступа: https://www.statista.com/statistics/273418/unadjusted-monthly-inflation-rate-in-the-us/
Moody’s Analytics. Analysis. Global Fiscal Policy in the Pandemic. February 24, 2022. 28 pp. Режим доступа: https://www.economy.com/economicview/analysis/387814/Global-Fiscal-Policy-in-the-Pandemic.pdf.
National Archives. Lend-Lease Act (1941). Режим доступа: https://www.archives.gov/milestone-documents/lend-lease-act.
NBER. US Business Cycle Expansions and Contractions. Режим доступа: https://www.nber.org/research/data/us-business-cycle-expansions-and-contractions
Office of the Director of National intelligence. 2022 Annual Report on Unidentified Aerial Phenomena. 12 January, 2023. 11 pp Режим доступа: https://www.dni.gov/index.php/newsroom/reports-publications/reports-publications-2023/item/2354-2022-annual-report-on-unidentified-aerial-phenomena.
Ortega R. Half of Americans anticipate a U.S. civil war soon, survey finds // Science, 22 July 2022, p. 357.
Probability of US Recession Predicted by Treasury Spread. Режим доступа: https://www.newyorkfed.org%2Fmedialibrary%2Fmedia%2Fresearch%2Fcapital_markets.pdf.
Salmon J. The Impact of Public Debt on Economic Growth. Cato Journal, Fall 2021, pp. 487-509. Режим доступа: DOI:10.36009/CJ.41.3.2.
Statesman & Commander in Chief: FDR in WWII 1941 – 1945. “We Are All In It”: Franklin D. Roosevelt and the American Home Front. 11 pp. Режим доступа: https://fdr4freedoms.org/statesman-commander-in-chief/
The American Presidency Project. Franklin D. Roosevelt. Message to Congress on Appropriations for National Defense. May 16, 1940. Режим доступа: https://www.presidency.ucsb.edu/node/209636.
The American Presidency Project. Franklin D. Roosevelt. Excerpts from the Press Conference. December 28, 1943. Режим доступа: https://www.presidency.ucsb.edu/node/209751.
The Conference Board Economic Forecast for the US Economy. September 2023. Режим доступа: https://www.conference-board.org/research/us-forecast
The National WWII Museum. FDR Approves Building an Atomic Bomb: 70th Anniversary October 9, 1941. Режим доступа: http://www.nww2m.com/2011/10/fdr-approves-building-an-atomic-bomb-70th-anniversary-october-9-1941/
The National WWI Museum. Research Starters: US Military by the Numbers. Режим доступа: https://www.nationalww2museum.org/students-teachers/student-resources/research-starters/research-starters-us-military-numbers.
Verbrugge R. and Saeed Z. Post-COVID Inflation Dynamics: Higher for Longer. Working Paper No. 23-06R. Federal Reserve Bank of Cleveland. June 2023. 46 pp. Режим доступа: https://doi.org/10.26509/frbc-wp-202306r.
Verbrugge R. and Zaman S. The Hard Road to a Soft Landing: Evidence from a (Modestly) Nonlinear Structural Model. Working Paper No. 23-03. Federal Reserve Bank of Cleveland. January 2023. 50 pp. Режим доступа: https://doi.org/10.26509/frbc-wp-202303.
U.S. Department of Treasury. Fiscal Data. Debt to the Penny. Режим доступа: https://fiscaldata.treasury.gov/datasets/debt-to-the-penny/debt-to-the-penny.
U.S. expenditures for defense and education, 1910-2021. Режим доступа: https://www.johnstonsarchive.net/policy/edgraph.html.

.jpg)
