
Development Strategy for Future India and Atmanirbhar Bharat: A Way Forward
[Чтобы прочитать русскую версию статьи, выберите русский в языковом меню сайта.]
Surender Kumar is senior professor at the Department of Economics, Delhi School of Economics, University of Delhi.
ORCID: 0000-0002-4217-7715
For citation: Kumar, Surender, 2023. Development Strategy for Future India and Atmanirbhar Bharat: A Way Forward. Contemporary World Economy, Vol. 1, No 4.
Keywords: development strategy, Atmanirbhar Bharat, inclusive development, developed nation, India.
Abstract
This article examines issues and development strategies for transforming the Indian economy into a developed nation by 2047, to which it aspires. We observe that the protectionist development strategy followed in the first four decades of independence could not bring the country out of poverty, and only protected vested interests. In the last three decades, the economy did reasonably well in terms of economic growth as a result of the adoption of the strategy of economic liberalization. The pitfalls of liberalization were realized in terms of increasing inequalities and external dependencies, and stagnancy in manufacturing capacity. COVID-19 exposed the limitations of global supply chains. To lessen the shortcomings of the liberalization, the Indian government introduced the Atmanirbhar Bharat Package. It is expected that the Package will make the economy competitive and enable India to achieve the objective of becoming an inclusive developed nation.
Introduction
In future years the Indian economy is poised to become the world’s third largest economy, and it aspires to be a developed economy by 2047, when the country celebrates 100 years of independence from colonial rule. A country is termed a developed country if the per capita annual income in it crosses a threshold of approximately USD 14,000, has a world-class infrastructure, and democratic governance. Indian Prime Minister Shri Narendra Modi considers this definition of a developed country too limiting. To have an all-inclusive development, he considers that the country has three major priorities: ensuring that young people enjoy good health and fitness and equipping them with the appropriate skills; fostering small and mid-sized enterprises and incentivizing them to create high productivity and high-wage jobs; and preparing capital markets and the financial sector to meet investment requirements [Chengappa 2024]. The question therefore is: What will take it for India to achieve all-inclusive and sustainable development?
During COVID-19, the government of India announced the Atmanirbhar Bharat Package1 (meaning the “self-reliant India” package)2 as an economic strategy to transform the economy into an economy of collective prosperity, in which equity is at its heart and development is environmentally sustainable. Note that the Atmanirbhar Bharat Package is not designed to discount the importance of markets in development or to replace the liberalization strategy, but to supplement it in order to lessen its ill effects.
Over the last 75 years, the Indian economy has transformed from an economy of shortage to an economy of adequacy. In 1947, India was an economy of severe scarcity and stagnation; poverty and unemployment were abundant; and there was a complete absence of a per capita income growth rate. During this period of independence, the population below the poverty line has declined substantially. In the beginning, the country adopted import substitution and state-owned heavy industry-led development as a strategy for economic development. In 1991, this strategy was replaced with one of economic liberalization, and India said goodbye to the license raj, the system of strict governmental regulation of the economy.
During the past three decades of liberalization, the economy did reasonably well. It progressed at an annual growth rate of 6%, with some ups and downs; a large base of physical and human infrastructure was created during this period. The economy has the potential to grow at an average rate of 8% per annum in the coming quarter-century.3 However, the progress accomplished was not uniform across various different sectors and regions, i.e., inequalities in the economy have increased.
It has also been observed that during the last three decades, the share of the manufacturing sector in GDP and employment has been more or less constant, raising the question of whether the Indian economy has been facing a problem of premature deindustrialization [Chakraborty and Nagaraj 2020]. Increasing integration of the Indian economy with the world economy has led to an increase in imports of intermediate inputs [Goldar et al. 2016], however, exports of final goods have not increased in that proportion, thus making the country vulnerable to external exigencies. The industrial base has not advanced in the required direction. Technological changes have made manufacturing skill- and capital-intensive, and less and less labor-absorbing [Rodrik and Stiglitz 2024]. The outbreak of COVID-19 exposed the pitfalls of hyper-globalization. Creating high productivity and decent jobs for young people has been the biggest challenge for policymakers. Moreover, the country is facing the challenges of the accelerating climate crisis and the need for a just and efficient energy transition.
This paper examines the development strategy transforming the Indian economy from a lower middle-income country to a developed economy by 2047, to which the country aspires. The paper also highlights structural changes and opportunities for the economy. The broad objective of the paper is to assess the factors that need to be critically analyzed to enable India to achieve its stated objective of an all-inclusive and sustainable development.
The rest of the paper is organized as follows: The next section provides an analysis of the development strategy and economic liberalization followed in the country. A snapshot of economic growth and the structural transformation trajectory, especially in the post-reform period, is described in Section 2. Section 3 discusses the way forward and the Atmanirbhar Bharat Package, and the paper closes in Section 4 with some concluding remarks.
1. Development strategy and economic liberalization
India is the fifth largest economy in the world and it has earned this status after a long journey of 75 years. It has a celebrated history of an ancient civilization dating back thousands of years, with periods of high prosperity and a rich cultural heritage. It was a poor and backward country on the eve of independence from British rule in 1947. Over this period, the trajectory of development has evolved through the ups and downs of economic performance [Ray 2016]. After independence, initially, the country followed a state-directed import substitution industrialization strategy with inward-looking bias. This strategy was replaced in 1990 with a more liberalized open economy framework, and much of the credit for today’s status can be attributed to this liberalized trade and industrial policy regime. This section briefly discusses the development strategy followed in the country.
Structural transformation is key to long-term economic growth. It involves the movement of economic resources from low-productivity to higher-productivity activities. As a result, aggregate productivity rises, and economic growth happens. To make this transformation a reality, an economic development strategy is a fundamental requirement. This strategy should be accompanied by economic policies and programs that facilitate this transformation [Rodrik and Stiglitz 2024]. Inclusive development involves the movement of people from professions with low to higher productivity; earnings increase and poverty is eliminated or reduced. Therefore, the development strategy should be focused on creating better and more productive jobs, i.e., a well-defined explicit strategy is required for rapid sustained economic development.
In its first four decades of independence, India followed an import-substitution industrialization strategy. Perhaps the key goal was to achieve self-reliance and mimic the development trajectory of developed countries [Ray 2016]. The country engaged in highly complex and resource-intensive activities without any concerns for its natural comparative advantage. To have a socialist pattern of development, Soviet-style central planning was the cornerstone of the development strategy. Though a mixed economy was envisioned, the public sector was expected to take the economy to commanding heights. In this strategy, trade was given little attention; trade policy was categorized by ubiquitous import and exchange control regimes. Quantitative restrictions with increasing tariffs were used to protect the domestic industry from global competition in the name of infant industries. For the sake of socialist ideals, monopolies and trade restrictions were imposed to restrict the concentration of economic power; a policy of industrial reservation was used to promote small-scale industries that produced livelihoods and income for the common man; a freight equalization policy was implemented to create regionally balanced economic development; and to ensure the availability of essential commodities such as steel, cement, fertilizers, pharmaceuticals, etc., a policy of price controls was employed. A proactive role of government in the provision of merit goods such as education and health was envisioned.
Though a mixed economy was imagined, a private capitalist class emerged in the country that had vested interests in protecting their businesses from global competition. The strategy of import-substitution and inward-looking development was in perfect harmony with their narrow-vested interests [Ray 2016]. The policy of license-permit raj created a rent-seeking bureaucracy, and the original policy goals took a back seat. The protectionist approach to development generated inefficiencies in the use and allocation of resources. There were no incentives for the manufacturing sector to become globally competitive, and Indian industry became technologically backward and cost-inefficient by international standards. The country had to settle for a low growth rate to the tune of 2-3% per annum, and it was branded as a laggard in terms of global growth [Lal 1988, 1989]. It remained a poor country with very low material capacity despite its rich heritage and vast endowments [Ray 2016]. It should be noted that protectionism is not bad in itself. For example, countries like the US, Germany, and South Korea followed the policy of protectionism to help domestic industry reach the level of global standards. Protectionism was shunned in favour of free trade once industry reached international standards in order to gain access to international markets. In India, domestic industry has not developed to compete at the global level and could not take advantage of global markets [Ravi 2023].
In the mid-1980s, it was realized that India’s inward-looking import substitution strategy could not produce the expected results, and that attention should be paid to improving efficiencies in the economy. It was also understood that it would be good for the economy to open its doors to global technologies. Moreover, given the success of the East Asian economies that followed an export-led and outward-looking industrialization strategy, the global scholarship on development strategy was also undergoing a metamorphosis. In this sense, this was the beginning of a shift in the development strategy from inward-looking import substitution to economic liberalization, but the approach was feeble and sporadic [Ray 2016]. In 1991, the country faced a severe balance of payment crisis and from this point, the development strategy shifted from inward-looking import substitution to the liberalization of the economy in order to realize development goals.
The government of India adopted a comprehensive structural reform and stabilization program in 1991 which ushered in a complete paradigm shift in policymaking, emphasizing the liberalization of economic activities from government control to and moving towards more reliance on market powers. To achieve economic efficiencies, a larger role for the private sector in order to secure economic security and the integration of the domestic economy with the world economy was foreseen. Trade was given due recognition in the growth strategy. In order to promote trade, quantitative restrictions were removed, tariffs were reduced, exchange rates were market-aligned, and an investor-friendly foreign direct investment policy was followed. In the industrial sector, industrial licensing was eliminated, the number of sectors reserved for the small-scale sector was reduced and the role of the public sector was redefined.
As a result of the liberalization of the economy, as stated above, the economy received a substantial boost in terms of economic activities and growth. However, India could not achieve a rapid expansion of labor-intensive manufacturing in the pre-liberalization period due to its autarkic trade policy. It could not achieve this expansion even in the post-liberalization period either. By the time India shifted its policy paradigm, competition in labor-intensive manufacturing had intensified, and India had lost out in the race against East and South-East Asian economies. Moreover, manufacturing has become more skill- and capital-intensive, and less labor-absorbing due to technological changes [Rodrik and Stiglitz 2024].
As an alternative to a protectionist import-substitution strategy, the strategy of economic liberalization seems attractive, but there is a need to be cautious in blindly adopting the beliefs of liberalization. The global financial crisis of 2008 and the outbreak of COVID-19 in 2020 exposed the dark side of the tenets of liberalization as a development strategy.
While the strategy of economic liberalization is based on certain beliefs, it is imperative to understand the implications of the challenges that liberalization poses. The strategy of liberalization believes that markets allocate resources productively and efficiently and it advocates for the minimal role of governments. A liberalization strategy could be beneficial at the aggregate level, but at the same time, it could be harmful for some. Its proponents assume that all growth is good irrespective of how its benefits are distributed. Moreover, they also believe that integration with the global market is beneficial as all countries work in cooperation. However, the major insight of welfare economics is that markets by themselves, in general, do not produce Pareto-efficient optimal outcomes [Greenwald and Stiglitz 2014]. There is a rich record of market failures, and governments have to take specific measures such as having industrial policies which would produce socially desirable results.
The Indian economy did well at the aggregate level during the last three decades (as discussed in Introduction), however, inequalities have widened. They have grown throughout the world, and India is not an exception. The World Inequality Report 2022 shows that the bottom 50% of the global population owns less than 1% of global wealth, whereas the top 10% owns more than 80% of the world’s total wealth. The report says that “Contemporary global inequalities are close to their early 20th-century level, at the peak of Western imperialism.”4 The share of the manufacturing sector in employment has been more or less constant for the last three decades and it has de facto declined during the liberalization period, i.e. the manufacturing sector could not create the desired quantum of employment. This has also been the result of technological changes that are increasingly skill and capital-intensive and less labor-intensive. Moreover, the outbreak of COVID-19 and other geopolitical events such as the Russia-Ukraine conflict have exposed the pitfalls of global integration and the vulnerability of global supply chains. It was seen that during these times, nationalism prevailed over globalization.
2. Growth and structural transformation in India
2.1 Economic growth
As stated above, the Indian economy was an economy of severe scarcity and stagnation on the eve of independence. During the first half of the 20th century, the economy grew at an annual growth rate of a mere 0.98% which was below the growth rate of the population. During the first three decades of planned economic development after independence, the economy was able to progress from the economic stagnation observed during the pre-independence era. However, the progress was not sufficient to alleviate the prevailing poverty and provide a dignified life for India’s citizens. During these three decades, the economy grew at an annual rate of less than 3.5%. The year 1991 is termed as a year of turnaround in the economy; the process of liberalization was initiated by unshackling the economy from the chains of the license permit raj. Enhancing the productivity and competitiveness of the economy was one of the prime objectives of the economic reforms. During the liberalization period of the last 30 years (1991-2019), the economy grew at an average annual compound growth rate of 6.4%.
Figure 1 displays the trajectory of economic growth as observed in the Indian economy over the last three decades. We use the Hodrick-Prescott (HP) filter to separate the trend from cyclical and irregular components.5 This filter can also be applied to non-stationary time series [Ravn and Uhlig 2002]. The trajectory shows that the economy has been growing continuously. From 2002 to 2016, the annual average observed growth rate of the economy has been 7.3%. The filtered series reveals that from 2001 to 2006, the Indian economy observed an increasing growth rate, reaching more than 8% in 2006. After that, it followed a downward trend to 2013 and then started moving up; it has again been witnessing a downward trend since 2016. It is observed that from 1991 to 2001, the Indian economy grew at a CAGR (compound annual growth rate) of 5.5% and the CAGR was 7.2% from 2002 to 2013. Over the next three years, the economy progressed at a rate of 7.5% per annum but in the last three years, the annual growth rate declined to 5.9%. Somehow reflecting that the growth momentum of the economy had started fading away even before the outbreak of COVID-19, in the year 2000, the economy observed a decline of about 7%. However, the economy started to recover immediately and in the years 2021 and 2022 its average growth rate was about 8%.
Figure 1: GDP growth rate in India, 1991-2019
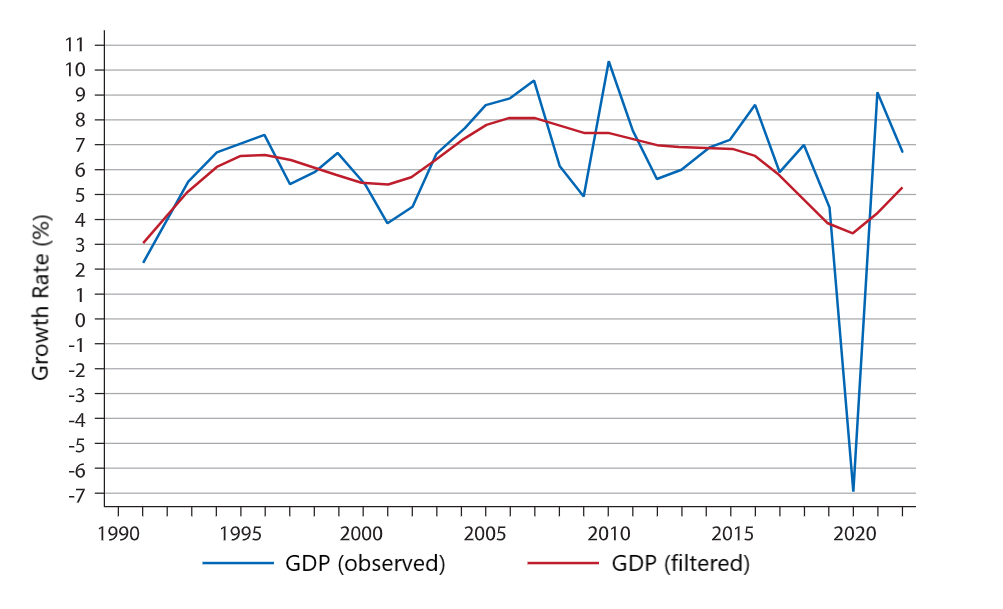
Source: Based on data from The Conference Board Total Economy Database (TED).
During the years 2017-2019 the economy observed a growth rate of 5.9, 7, and 4.5%, revealing that the slowdown started before the outbreak of COVID-19. In the first year of the pandemic, the economy observed a negative growth rate of -7%, and then recovery began, and the economy grew at a rate of 9.1 and 6.7% in the years 2021 and 2022 respectively.
As stated above, the economy aspires to be a developed nation by 2047 which requires that the per capita income should cross the threshold of USD 14,000 at constant prices, given the current level of per capita income of about USD 2,400. The economy needs to grow at a steady rate of more than 7% per annum in real terms for the coming quarter century, and given the current growth rate and momentum of reforms, it seems doable.
Reducing poverty and unemployment is one of the major concerns of India’s economic development strategy. During the post-independence period, poverty in the country declined substantially. Datt et al. (2016) show that poverty has declined in the country, but the decline rate in the post-reform period has been much higher in comparison to the pre-reform period. In the pre-reform period, the decline rate was a mere 0.44 percentage points per year, which in the post-reform period has increased to 1.36 percentage points. The decline rate of poverty was also lower in the initial years of reform; this rate increased in later years. During the period from 1993 to 2005 poverty declined by 0.74 percentage points per year, which increased to by 2.2 percentage points per annum during 2005-2012.
On the poverty trends in post 2011-12, there is a heated debate about whether poverty has in fact been declining in the country. Some studies such as Subramaniam (2019) show that during 2011-12 to 2017-18, poverty increased, whereas Bhalla et al. show that, the level of extreme poverty measured in terms of PPP$ 1.9 was as low as 0.9% in 2019. Panagariya and More (2023) estimate poverty during the pre-pandemic and post-pandemic periods and show that poverty has continuously been declining in both rural and urban areas, except during the period of strict lockdown in rural areas, during which it increased. In urban areas the reverse trend in poverty decline persisted a couple of quarters beyond the strict lockdown period. Recently released Household Consumption Expenditure Survey data for the year 2022-23 shows that rural poverty has declined to 7.2% and urban poverty has come down to 4.6% in 2022-23.6
A recently released discussion paper by NITI Aayog, the Indian government’s policy think tank, by Chand and Suri (2024) presents estimates of multi-dimensional poverty in the country from 2005-2006. The paper shows that multi-dimensional poverty has sharply declined from more than 50% to 11.28% in the last two decades. The rate of decline has accelerated especially in the last decade as a result of government initiatives targeted at improving specific aspects of deprivation.
2.2 Structural transformation
Structural transformation is at the heart of economic development. It is defined as a movement of the labor force from lower productive economic activities to higher productive economic activities. In the earlier literature, structural change has been contemplated as a movement of workers from the agricultural to the non-agricultural sector; agriculture is generally considered a low-productive sector in comparison to non-agricultural sectors [e.g. Lewis 1954]. In the subsequent literature, structural change is defined as a shift of resources from agriculture to manufacturing and further from manufacturing to services [Denison 1967; Maddison 1987; Jorgenson and Timmer 2011]. Structural transformation also involves a change in the scale of economic activities. In a broader sense, structural change involves the reallocation of resources from lower productive economic activities to high or higher productive modern activities, as a result of which the aggregate economy improves with a higher standard of living for its citizens. Moreover, it should be noted that given sector or industry heterogeneity, productivity levels may differ within industries/sectors as technological changes occur. This sub-section provides a brief sketch of structural transformation in India over the last three decades.
Tables 1 and 2 show the industry share in total value-added and employment in the Indian economy from 1990-91. There is a steady decline in the agriculture sector’s share over time; the share of agriculture in value-added has declined from 33.91% to 19.77% from 1990-91 to 2018-19, and agriculture’s share in employment (64.30% in 1990-91 to 41.67% in 2018-19) has also declined, consistent with the growth theory which states that, as an economy progresses, there is a movement of workforce from less productive traditional sectors (the agriculture sector) to more productive modern sectors (manufacturing and service). Despite the decline in employment and value-added in the primary sector, it still accounts for 44% of total employment in India.
However, the decline in employment in the agriculture sector is not absorbed by the manufacturing sector, since the employment share in the manufacturing sector increased marginally from 10.68% to 11.16% during the same period. Moreover, the share of manufacturing in value-added has decreased from 19.60% to 16.35% in total value added to the economy. There is literature discussing whether premature deindustrialization is happening in India. Amirapu and Subramanian (2015), using state-level information, show that most Indian states have improved in terms of share of manufacturing in GDP and employment in the 1990s. Only Gujarat has achieved a share of about 25% of the state’s gross domestic product. But Chakraborty and Nagaraj (2000) reveal that though there is stagnation at the aggregate level, some structural changes have been taking place within the manufacturing sector.
Most of the decline in employment in the agriculture sector is absorbed in construction. The share of employment in the construction sector rose from 3.7% to nearly 12% during this period. The absolute number of laborers involved in the agriculture sector has been in decline since 2005-06 and the construction sector was able to absorb a large proportion of this decline till 2011-12, varying between 50 and 90%. The absorption in the construction sector has been low during the period 2012-12 to 2017-18, not exceedingly more than 31% in any single year. The decline in the absorption rate may be attributed to the slowdown in growth in the construction sector. The other sector that could absorb the labor force released from the agriculture sector was the trade sector, a sub-sector of the service sector. Its share has varied in the range of 10 to 13% during the period of 2005-06 to 2017-18.
This reveals the fact that the unskilled labor force has not been absorbed in semi-skilled jobs in manufacturing entities, but rather ends up moving to unskilled construction jobs. However, the value-added of construction saw a rise from 4% to 8% over the same period implying a decline in labor productivity, measured as value-added per unit of labor, in construction. However, this does not imply a decline in labor productivity in the agriculture sector though labor productivity in the agriculture sector continues to rise over time [Kumar 2022]. Part of the reason behind the consistent rise in labor productivity in the primary sector can be explained by two factors: one, the movement of surplus labor from agriculture to the construction sector increased the labor productivity level of the existing employees, and two, the mining and quarrying industry experienced a tremendous rise in labor productivity which boosted the labor productivity of the primary sector.
Within the manufacturing sector, industries that have shown a declining trend over time in terms of value-added are manufacturing, nec (not elsewhere classified); recycling, other non-metallic minerals products, and transport equipment. Industries like chemical and chemical products and basic metals and fabricated metal products show a rising trend in value-added share over time. The industries that gained employment share over time are manufacturing, nec, recycling, basic metals and fabricated metal products, electrical and optical equipment, rubber and plastic products. On the other hand, traditional sectors within manufacturing industries like textiles and wood products lose the share of the workforce that shifts to modern manufacturing industries. Food products and textiles constitute nearly 50% of employment in the manufacturing sector.
The service sector has been a major contributor to value-added since the 1980s; the share of the service sector in total value-added rose very sharply from 43% to 56%; within the service sector transport and storage, education, post and telecommunication constitute nearly one-fourth of the total contribution of the service sector in aggregate value-added of the economy. Despite having a big share in value-added, all three industries lost their contribution in value-added to the service sector; transport and storage reduced from 12% to 5%, post and telecommunication reduced from 6% to 1.5% and education shrank from 7.45% to 4.35%. Trade accounts for a major employment share in the service sector over time (7.34% to 11.32%), while industries that gained a share in employment are transport and storage, financial services, business services, hotels and restaurants, and public administration and defense.
Table 1. Industry shares in aggregate nominal value added (%)
|
Industry/Industry groups |
1990-91 |
1995-96 |
2000-01 |
2006-07 |
2011-12 |
2015-16 |
2018-19 |
|
A. Agriculture, Hunting, Forestry and Fishing |
33.91 |
31.40 |
28.75 |
23.76 |
23.51 |
22.67 |
19.77 |
|
Agriculture |
29.47 |
26.82 |
23.69 |
18.34 |
18.53 |
17.71 |
17.58 |
|
Mining and Quarrying |
4.45 |
4.59 |
5.06 |
5.42 |
4.98 |
4.96 |
2.20 |
|
B. Manufacturing |
19.60 |
21.26 |
18.18 |
19.00 |
17.18 |
17.14 |
16.35 |
|
Food Products, Beverages and Tobacco |
1.95 |
1.96 |
2.01 |
2.39 |
2.07 |
1.70 |
1.93 |
|
Textiles, Textile Products, Leather and Footwear |
2.93 |
2.76 |
2.31 |
2.28 |
1.89 |
2.39 |
2.10 |
|
Wood and Wood Products |
0.50 |
0.76 |
0.59 |
0.29 |
0.27 |
0.28 |
0.27 |
|
Pulp, Paper, Paper products, Printing and Publishing |
0.66 |
0.70 |
0.42 |
0.46 |
0.48 |
0.43 |
0.42 |
|
Manufacturing, nec; recycling |
1.04 |
1.10 |
1.12 |
1.92 |
0.97 |
1.56 |
0.53 |
|
Coke, Refined Petroleum Products and Nuclear fuel |
0.97 |
0.86 |
1.09 |
0.51 |
0.56 |
0.64 |
0.90 |
|
Chemicals and Chemical Products |
1.19 |
1.23 |
1.03 |
1.11 |
1.18 |
0.97 |
2.42 |
|
Rubber and Plastic Products |
3.07 |
3.32 |
2.63 |
3.33 |
2.83 |
1.85 |
0.60 |
|
Other Non-Metallic Mineral Products |
1.76 |
1.82 |
1.33 |
1.37 |
1.55 |
1.11 |
1.04 |
|
Basic Metals and Fabricated Metal Products |
0.94 |
0.92 |
0.78 |
1.07 |
1.01 |
0.95 |
2.13 |
|
Machinery, nec. |
1.49 |
1.91 |
1.31 |
1.43 |
1.64 |
1.86 |
1.15 |
|
Electrical and Optical Equipment |
0.39 |
0.48 |
0.50 |
0.45 |
0.44 |
0.74 |
0.88 |
|
Transport Equipment |
2.70 |
3.44 |
3.05 |
2.39 |
2.30 |
2.66 |
1.98 |
|
C. Construction |
3.38 |
4.76 |
4.79 |
5.85 |
5.92 |
5.78 |
7.87 |
|
D. Services |
43.10 |
42.58 |
48.28 |
51.39 |
53.39 |
54.41 |
56.01 |
|
Trade |
1.04 |
1.06 |
1.35 |
1.39 |
1.35 |
1.55 |
11.39 |
|
Transport and Storage |
12.15 |
10.44 |
10.03 |
8.57 |
9.36 |
9.60 |
4.70 |
|
Financial Services |
1.44 |
2.09 |
2.12 |
2.13 |
2.51 |
2.59 |
5.57 |
|
Business Services |
2.90 |
2.56 |
2.59 |
3.31 |
3.22 |
2.34 |
8.14 |
|
Electricity, Gas and Water Supply |
1.17 |
1.74 |
1.97 |
2.12 |
1.55 |
1.89 |
2.63 |
|
Hotels and Restaurants |
1.63 |
2.07 |
4.13 |
5.78 |
5.54 |
7.62 |
1.05 |
|
Post and Telecommunication |
6.00 |
5.54 |
6.70 |
5.32 |
6.06 |
5.82 |
1.50 |
|
Other services |
2.34 |
2.38 |
3.10 |
2.86 |
3.30 |
3.72 |
8.95 |
|
Public Administration and Defense; Compulsory Social Security |
6.29 |
5.76 |
6.86 |
9.17 |
9.59 |
7.88 |
6.09 |
|
Education |
7.45 |
8.15 |
8.49 |
9.60 |
9.79 |
10.40 |
4.35 |
|
Health and Social Work |
0.68 |
0.78 |
0.95 |
1.14 |
1.11 |
1.01 |
1.65 |
|
Total |
100.00 |
100.00 |
100.00 |
100.00 |
100.00 |
100.00 |
100.00 |
Note: nec: not elsewhere classified. Source: Computations based on KLEMS data, Reserve Bank of India.
Table 2. Industry shares in aggregate employment (%)
|
Industry/Industry groups |
1990-91 |
1995-96 |
2000-01 |
2006-07 |
2011-12 |
2015-16 |
2018-19 |
|
A. Agriculture |
65.30 |
63.49 |
59.94 |
55.03 |
48.42 |
44.65 |
41.67 |
|
Agriculture, Hunting, Forestry and Fishing |
64.59 |
62.81 |
59.30 |
54.46 |
47.87 |
44.19 |
41.25 |
|
Mining and Quarrying |
0.71 |
0.68 |
0.64 |
0.57 |
0.55 |
0.46 |
0.42 |
|
B. Manufacturing |
10.68 |
10.47 |
10.93 |
11.49 |
11.77 |
11.52 |
11.16 |
|
Food Products, Beverages and Tobacco |
2.34 |
2.48 |
2.51 |
2.30 |
2.41 |
2.16 |
1.95 |
|
Textiles, Textile Products, Leather and Footwear |
3.42 |
2.95 |
2.93 |
3.26 |
2.92 |
2.89 |
2.55 |
|
Wood and Products of wood |
0.90 |
0.94 |
1.13 |
1.05 |
0.82 |
0.69 |
0.61 |
|
Pulp, Paper, Paper Products, Printing and Publishing |
0.28 |
0.27 |
0.32 |
0.35 |
0.33 |
0.36 |
0.39 |
|
Manufacturing, nec; recycling |
0.86 |
0.84 |
0.83 |
1.09 |
1.29 |
1.16 |
1.18 |
|
Coke, Refined Petroleum Products and Nuclear fuel |
0.03 |
0.03 |
0.03 |
0.03 |
0.03 |
0.04 |
0.05 |
|
Chemicals and Chemical Products |
0.43 |
0.46 |
0.45 |
0.45 |
0.43 |
0.46 |
0.49 |
|
Rubber and Plastic Products |
0.14 |
0.17 |
0.18 |
0.19 |
0.25 |
0.25 |
0.28 |
|
Other Non-Metallic Mineral Products |
0.89 |
0.85 |
0.86 |
1.00 |
1.05 |
0.94 |
0.85 |
|
Basic Metals and Fabricated Metal Products |
0.77 |
0.77 |
0.86 |
0.86 |
0.97 |
1.02 |
1.08 |
|
Machinery, nec. |
0.18 |
0.23 |
0.31 |
0.33 |
0.40 |
0.53 |
0.64 |
|
Electrical and Optical Equipment |
0.23 |
0.25 |
0.26 |
0.31 |
0.53 |
0.65 |
0.73 |
|
Transport Equipment |
0.23 |
0.23 |
0.24 |
0.27 |
0.34 |
0.37 |
0.38 |
|
C. Construction |
3.73 |
3.90 |
4.52 |
6.64 |
10.33 |
11.21 |
11.93 |
|
D. Services |
20.30 |
22.14 |
24.61 |
26.83 |
29.49 |
32.61 |
35.23 |
|
Trade |
7.34 |
8.02 |
9.08 |
9.70 |
10.06 |
10.66 |
11.32 |
|
Transport and Storage |
2.57 |
2.82 |
3.34 |
3.76 |
4.12 |
4.69 |
4.97 |
|
Financial Services |
0.51 |
0.58 |
0.57 |
0.75 |
0.95 |
1.07 |
1.22 |
|
Business Services |
0.30 |
0.41 |
0.65 |
1.06 |
1.62 |
2.34 |
2.83 |
|
Electricity, Gas and Water Supply |
0.32 |
0.29 |
0.28 |
0.30 |
0.34 |
0.41 |
0.42 |
|
Hotels and Restaurants |
0.91 |
0.95 |
1.17 |
1.43 |
1.70 |
1.87 |
1.94 |
|
Post and Telecommunication |
0.18 |
0.24 |
0.33 |
0.42 |
0.37 |
0.39 |
0.37 |
|
Other services |
3.14 |
3.76 |
3.86 |
4.01 |
4.56 |
4.79 |
5.23 |
|
Public Administration and Defense; Compulsory Social Security |
2.84 |
2.64 |
2.47 |
1.90 |
1.76 |
1.71 |
1.71 |
|
Education |
1.62 |
1.85 |
2.15 |
2.65 |
3.01 |
3.50 |
3.87 |
|
Health and Social Work |
0.56 |
0.60 |
0.72 |
0.86 |
0.99 |
1.18 |
1.36 |
|
Total |
100 |
100 |
100 |
100 |
100 |
100 |
100 |
Note: nec: not elsewhere classified. Source: Computations based on KLEMS data, Reserve Bank of India.
The declining or stagnating share of manufacturing in value-added and employment raises the question of whether Indian manufacturing is experiencing premature deindustrialization, or whether this is an optical illusion. In the post-reform period, the effective protection of manufacturing vis-à-vis services has come down [Das 2016]. It is also possible that during this period the ratio of prices of non-traded to traded goods might have increased. In this kind of situation, the trends in nominal value-added (current prices) understate the true growth in manufacturing vis-à-vis service sectors [Oda and Strap 2003; Ross and Skott 1998; Sell 1988]. Goldar et al. (2016) observe that computation of value-added in manufacturing and services with proper deflation raises the share of manufacturing in gross value-added in the economy. Moreover, the declining trend in the employment share of manufacturing vis-à-vis services may be due to the splintering of services from manufacturing [Goldar et al. 2018; Banga and Goldar 2007, Bhagwati 1984].
The above discussion reveals that though the share of the agriculture sector both in employment and value-added has been declining, most of the decline in labor share has been absorbed by the construction sector rather than manufacturing. The share of the manufacturing sector in employment and value-added has been more or less constant throughout the period under consideration. The share of the service sector in value-added has substantially increased, but the share of employment has not increased in that proportion. It is worth noting that though there is no structural change as far as the manufacturing sector is concerned, some structural change has been occurring within the manufacturing and service sectors. For example, the share of chemicals and chemical products, basic metals and fabricated metal products, and electrical and optical equipment subsectors, which are generally considered modern sub-sectors, in the manufacturing sector both in terms of value-added and employment has increased.7 Similarly, the share of trade, financial, and business services has substantially increased in the aggregate value-added, but the contribution of transport and storage, telecommunication and postal services and education services has declined over the period. In terms of employment, the share of almost all service subsectors has increased, but the rate of increase is not uniform across sub-sectors.
3. Atmanirbhar Bharat and a way forward
India needs an alternative development strategy that on the one hand, would bring the benefits of market efficiencies and on the other hand, take care of national interests. This strategy should lead to an economic state in which the country achieves not only the status of a developed country, but also in which development is inclusive. Market forces do not work in a vacuum. The success of markets in generating efficiencies is linked to the creation of institutions and their enforcement. Government expenditures in infrastructure, regulations, and policies shape markets. This implies that the Indian development strategy should be accompanied by fundamental capabilities, so that the country can achieve the status of an inclusive, developed country by 2047.
During COVID-19, the vaccine war between developed and developing countries exposed the pitfalls of liberalization-based globalization. National interests triumphed over humanitarian needs. It revealed that in desperate and extreme circumstances, globalization conflicted with national interests, rather than enabling cooperation. India could vaccinate more than a billion people on account of its domestic production of and research into COVID-19 vaccines. This made the country rethink its national interests related to self-reliance, harvesting market efficiencies, and globalization [Ravi 2023]. It should be noted that India was already witnessing a decline in its manufacturing base, growing income and wealth inequalities, and climate change challenges. Given the pre- and post-COVID-19 worlds, in May 2020, the Indian government came out with an economic strategy known as the Atmanirbhar Bharat (self-reliant India) Package8 that aims not only to make the country self-reliant but also enable it to realize the benefits of a market economy which is globally integrated.
It should be noted that the new strategy of self-reliance is different from the protectionist strategy followed in the past in the name of fledgling industries. The country paid a high price for earlier self-reliance in the form of low economic growth and a high level of poverty. This new kind of self-reliance is different from being self-centered or autarky [Ravi 2023]. The new definition of self-reliance is based on the concept of vasudhaiva kutumbakam (the world is one family) which considers Indian economic progress as part and parcel of the progress of humanity.9
The Atmanirbhar Bharat Package relies on five features: economy, infrastructure, system, vibrant demography, and demand. In terms of the economy, it says that given the size of Indian society, every solution should be scalable, so that economies of scale are realized and the economy becomes cost-competitive. As stated above, markets do not work in a vacuum, fundamental capabilities shape markets and enhance their efficiencies. There is a need to make huge investments in modern infrastructure. Infrastructure investments involve lock-in characteristics. For example, once an investment is made in fossil-fuel-intensive infrastructure, it will continue to operate for a long period, and this will be problematic in terms of meeting climate change challenges. This implies that the country should make huge investments in creating modern infrastructure that is energy efficient and less fossil-fuel energy intensive. India is a constitutional democracy and the new development strategy should utilize the latest technologies. An economic system based on modern technologies creates trust and enhances economic efficiencies and progress. Such a system is just for all. The Atmanirbhar Package is designed to create a modern, technology-based, efficient system. It is said that demography shapes the challenges and opportunities that a society faces. India not only has the largest population in the world; the population is diverse and young. If good health and fitness are ensured and young people are equipped with the appropriate skills, then the country will be able to garner the demographic dividend, i.e. the country needs to focus on health and education.
In a recent paper published in Econometrica, Goldberg and Reed (2023) show that in a world in which national interests prevail over humanitarian needs, it is the size of the domestic market that determines the path of economic development. A large domestic market allows countries to exploit economies of scale. Therefore, in the new development strategy, emphasis has been put on strengthening demand and supply chains to full capacity, which involves all the stakeholders in the supply chain in order to increase, as well as achieve, demand. In the package, emphasis has been given to the factors of production and institutions as well as to various sectors including cottage industries, MSMEs, laborers, the middle class, and industry, among others.
In the past years, several measures were taken to lessen the supply-side constraints in the economy. These measures include an easy, rational, strong, and digital financial system, supply chain reforms for agriculture, a simple and rational tax system, straightforward and clear business laws, capable human resources, and reforms of labor laws. An efficient and strong financial sector is required to meet the financial and investment needs of the country. These reforms will promote businesses, attract investments, and further strengthen the manufacturing policy, “Make in India.” It is expected that the Atmanirbhar Bharat Package coupled with the fundamentals that remove supply-side constraints will increase efficiency in various sectors and make the country competitive on the international market. It is also expected that such kind of growth will be more socially harmonious.
Given the objective of the Atmanirbhar Viksit Bharat (self-reliant developed India), during the lockdown period, the government of India, rather than handing out grants, decided to spend on infrastructure to spur growth and create jobs. In the last decade, spending on infrastructure has increased about five times. Moreover, along with focusing on the conventional sectors through the “Make in India” initiative, the need to leapfrog into modern technology-oriented sectors has been realized. Projects on mastering quantum computing, semiconductor chip manufacturing and artificial intelligence, and strengthening collaborations with major countries such as the US have been launched [Chengappa 2024]. The country has become an exporter in the areas in which it was dependent on the outside world, such as mobile phones and drones. The space sector has also been opened up to the private sector; the synergy between the private and public sectors is breaking past taboos and helping the country to achieve its desired goal.
In the last few years, the Indian economy has been on a path of resilient growth. Job creation and employment have increased continuously; the unemployment rate has declined to 3.2% in 2022-23 from 6.1% in 2017-18. A manageable current account deficit (CAD) coupled with controllable inflation is a reflection of a healthy macroeconomic situation. Trade-oriented external dependence reflected in terms of CAD is manageable. In the economy, large-scale digital public infrastructure has been created and digital payments have been taking place. The financial sector which was suffering from the problem of twin-balance sheets10 has become healthy and meets the financial requirements of the economy. Gross non-performing assets as a ratio of gross advances have declined substantially from about 11% in 2017-18 to a only about 3.2% in 2022-23 [Ministry of Finance 2024]. Increasing indirect tax revenues may be considered as an indicator of enhancing economic activities. Moreover, we find that in recent years, there has been a huge boost in the creation of physical infrastructure in the economy. Figure 2 displays growth in India’s transport infrastructure over the last decade.
Figure 2: Improvement in physical infrastructure
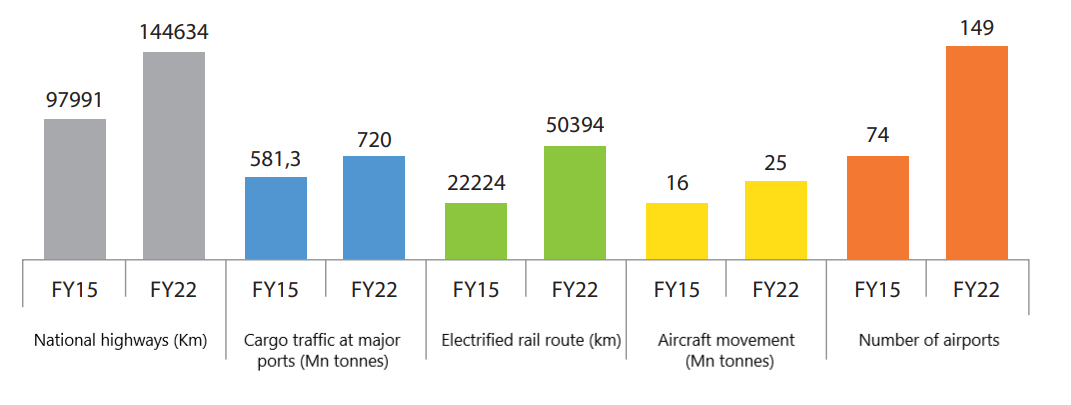
Source: Key features of Budget 2024-2025 (https://www.indiabudget.gov.in/doc/bh1.pdf as accessed on 24 February 2024)
As outlined above, the Indian economy was slowing down even before the outbreak of COVID-19, and it was supposed to be one of the most vulnerable economies due to the global pandemic. In the pandemic year, it declined by 7%. As a result of the short- and long-term measures taken during the pre- and post-pandemic periods and the development strategy followed, the economy has not only recovered from the setbacks of COVID-19 but has been doing reasonably well, and is termed as one of the fastest-growing major economies in the world. A recent report shows that post-COVID-19 growth is inclusive as the bottom 20% were able to recover relatively more as shown in the figure.11
Figure 3: Post-COVID-19 inclusive recovery in household income. Average annual household income in Rs Lakh, 2011-12 prices

4. Concluding remarks
The country aspires to be a developed nation by 2047; to achieve this status it needs to grow at a rate of more than 7% per year in real terms. Achieving this status in an inclusive way necessitates that this growth, not merely at the aggregate level, should take place across all sectors and sections including the cottage industry, MSMEs, laborers, the middle class, and industry, among others. Such growth requires both structural transformation and the development of the fundamentals (e.g., physical and human infrastructure) of growth that facilitate structural transformation.
COVID-19 and recent geopolitical events have revealed the pitfalls of globalization-based liberalization; national interests have prevailed over the global common good. This means that sustained and inclusive development requires a strategy that on the one hand, enhances competitiveness and economic efficiencies in the economy and, on the other hand, reduces its external dependencies. India’s experience in the agricultural sector shows that sustained growth requires self-reliance and not autarky. The country has achieved self-reliance in agriculture by adopting the best available technologies, following farm-centric government policies, and cooperating with farmers, rather than continuing to import foodgrains.
Over the last 75 years, the transformation of economic activities from low- to high-productive economic activities has been observed. The share of the agriculture sector in output and employment has significantly declined, however, the share of primary activities, especially the agricultural sector in employment is still very high. In the last three decades of economic liberalization, the economy did reasonably well in terms of aggregate growth, but the growth across sectors and sections of society is not uniform. During this period, economic growth has been accompanied by increasing economic inequality and external dependencies. A productivity increase across the sectors is required, and the country cannot afford to ignore any sector in terms of structural transformation in order to achieve the status of a developed nation.
In 2020, the Indian government launched the Atmanirbhar Bharat Package, which is designed to enhance competitiveness, facilitate enabling economies of scale, focus on innovations and modern technologies, judiciously employing all productive resources, especially human resources, and augment domestic markets by increasing people’s purchasing power. This kind of development strategy is expected to bring the required structural transformation and develop the fundamentals that facilitate that transformation. The economic achievements of the last three years testify to the significance of this development strategy.
Bibliography
Amirapu, A., and Subramanian, A., 2015. Manufacturing or Services? An Indian Illustration of a Development Dilemma. Available at: https://www.cgdev.org/sites/default/files/CGD-Working-Paper-409-Amirapu-Subramanian-Manufacturing-Services-India.pdf (accessed 30 March 2024).
Banga, R., and Goldar, B., 2007. Contribution of Services to Output Growth and Productivity in Indian Manufacturing, Economic and Political Weekly [e-journal] 42(26). Available at: Economic and Political Weekly website, https://www.epw.in/journal/2007/26/special-articles/contribution-services-output-growth-and-productivity-indian (accessed 30 March 2024).
Bhagwati, J. N., 1984. Splintering and Disembodiment of Services and Developing Nations. The World Economy, [e-journal] 7(2), pp.133-144. https://doi.org/10.1111/j.1467-9701.1984.tb00265.x
Bhalla, S., Bhasin, K., and Virmani, A., 2022. Pandemic, Poverty, and Inequality: Evidence from India. IMF Working Paper no.2022/069. Available at: https://www.imf.org/en/Publications/WP/Issues/2022/04/05/Pandemic-Poverty-and-Inequality-Evidence-from-India-516155 (accessed 30 March 2024).
Chakrabarty, J., and Nagaraj, R., 2020. Has India deindustrialized prematurely, after three decades of free-market reforms? A Disaggregated Analysis. Economic and Political Weekly, [e-journal] LV(48), pp.40-47. Available at: https://www.researchgate.net/publication/348480621_Has_India_Deindustrialised_Prematurely_A_Disaggregated_Analysis (accessed 30 March 2024).
Chand, R., and Suri, Y., 2024. Multidimensional Poverty in India since 2005-06. Available at: https://www.niti.gov.in/sites/default/files/2024-01/MPI-22_NITI-Aayog20254.pdf (accessed 30 March 2024).
Chengappa, R., 2024. Redefining Bharat. [online]. Available at: https://www.indiatoday.in/magazine/cover-story/story/20240108-newsmaker-of-the-year-pm-narendra-modi-redefining-bharat-2482036-2023-12-30 (Accessed 30 March 2024).
Das, D. K., 2016. Trade Policy and Manufacturing Performance: Exploring the Level of Trade Openness in India’s Organized Manufacturing in the Period 1990-2010. Working Papers id:9073, eSocialSciences. Available at: https://ideas.repec.org/p/ess/wpaper/id9073.html (accessed 31 March 2024).
Datt, G., Ravallion, M., and Murugai, R., 2016. Growth, Urbanization and Poverty Reduction in India. Policy Research Working Paper 7568, World Bank. DOI:10.1596/1813-9450-7568
Denison, E. F., 1967. Why Growth Rates Differ., Washington, DC: Brookings.
Dev, S. M. 2021. Beyond India @75: Growth, Inclusion and Sustainability. Working Paper no. WP-2021-026, Indira Gandhi Institute of Development Research. [Accessed 01 April 2024].
Goldar, B., Krishna, K. L., Aggarwal S.C., Das D.K., Erumban A.A., and Das P.C., 2016. Productivity growth in India since the 1980s: the KLEMS approach. Indian Economic Review, 52(1/2), pp.37-71.
Goldar, B., Banga, R., and Banga, K., 2018. India’s Linkages into Global Value Chains: The Role of Imported Services. In Shah, S., Bosworth, B., and Muralidharan, K., (eds.), India Policy Forum 2017-18, 14(1), pp.107-172.
Goldberg, P. K., and Reed, T., 2023. Presidential Address: Demand‐Side Constraints in Development. The Role of Market Size, Trade, and (In) Equality. Econometrica, 91(6), pp.1915-1950. https://doi.org/10.3982/ECTA20787
Greenwald, B., and Stiglitz, J.E., 2014. Industrial Policies, the Creation of a Learning Society, and Economic Development, in Stiglitz, J.E., and Lin, J., eds., The Industrial Policy Revolution. Basingstoke and New York: Palgrave Macmillan.
Jorgenson, D.W., and Timmer, M.P., 2011. Structural change in advanced nations: A new set of stylized facts, Scandinavian Economic Journal 113(1), pp.1-29.
Kumar, S., 2022. Economic growth prospect for India: A Sectoral Analysis. Manuscript.
Lal, D., 1988, 1989. The Hindu Equilibrium, Vols. I and II. Oxford: Oxford University Press.
Lewis, W.A., 1954. Economic development with unlimited supplies of labour. The Manchester School, 22(2), pp.139-191. https://doi.org/10.1111/j.1467-9957.1954.tb00021.x
Maddison, A., 1987, Growth and slowdown in advanced capitalist economies: techniques of quantitative assessment. Journal of Economic Literature, 25 (2), pp.649-698.
Ministry of Finance, 2024. Highlight of Budget 2024-25, Ministry of Finance, Government of India, New Delhi.
Oda, M., and R. Strapp, 2003. On the price of non-traded goods. Indian Economic Review, 38(1), pp.115-123.
Panagariya, A., with More, V., 2023. Poverty and Inequality Before and after Covid, paper presented at Columbia Summit on Indian Economy, New York.
Ravi, S., 2023. Making India Self-Reliant. EAC-PM Working Paper Series EAC-PM/WP/19/2023, Economic Advisory Council, Prime Minister, Government of India, New Delhi. Available at: https://eacpm.gov.in/wp-content/uploads/2023/07/19-Atmanirbhar-India.pdf
Ravn, M. O., and Uhlig, H., 2002. On Adjusting the Hodrick-Prescott Filter for the Frequency of Observations. The Review of Economics and Statistics, MIT Press, 84(2), pp.371-75.
Ray, A. S., 2016. The enigma of the “Indian model” of development, Rethinking Development Strategies after the Financial Crisis, 2. New York: United Nations.
Rodrik, D., and Stiglitz, J.E., 2024. A New Growth Strategy for Developing Nations. [pdf] Available at: https://drodrik.scholar.harvard.edu/sites/scholar.harvard.edu/files/dani-rodrik/files/a_new_growth_strategy_for_developing_nations.pdf
Ros, J., and Skott, P., 1998. Dynamic effects of trade liberalization and currency overvaluation under conditions of increasing returns, The Manchester School, 66(4), pp.466-89.
Sell, F. L., 1988. “True exposure": The Analytics of Trade Liberalization in a General Equilibrium Framework. Kiel Working Papers 312, Kiel Institute for the World Economy (IfW Kiel), 124(4), pp. 635-652.
Subramanian, S., 2019. What is Happening to Rural Welfare, Poverty, and Inequality in India [online]. Available at: https://www.theindiaforum.in/article/what-happened-rural-welfare-poverty-and-inequality-india-between-2011-12-and-2017-18 (accessed 02 April 2024).
Notes
1 Editor’s note: Bharat is the Hindi self-designation of India, which has been increasingly used in political discourse in recent years.
2 PM gives a clarion call for Atmanirbhar Bharat. Available at: https://pib.gov.in/PressReleasePage.aspx?PRID=1623391 (accessed 15 January 2024).
3 Dev (2021) observes that the Indian economy has the potential to grow at an annual growth rate of 7-8%.
4 https://wir2022.wid.world/chapter-2/#:~:text=%E2%80%9CContemporary%20global%20inequalities%20are%20close,inequalities%20between%20countries%20have%20declined (accessed 26 January 2024).
5 We use the HP filter for separating the trend growth in GDP, factor inputs, and TFP from cyclical and irregular components. Therefore in all the figures, the trend growth line of the related variable is based on filtered series of the variable.
6 https://economictimes.indiatimes.com/news/economy/indicators/indias-poverty-rate-declined-to-4-5-5-in-2022-23-sbi-research/articleshow/108029519.cms?from=mdr (accessed 28 February 2024).
7 Formalization of informal manufacturing is an important aspect of structural transformation in India and this aspect is not visible in the KLEMS data, but it is vital for understanding the dynamics of Indian economic growth.
8 https://pib.gov.in/PressReleasePage.aspx?PRID=1623391 (accessed 15 January 2024).
9 When announcing the Atmanirbhar Bharat Package on 12 May 2020, Indian Prime Minister Shri Narendra Modi clarified that Atmanirbhar (self-reliance) does not mean being self-centered. The new definition is based on Indian culture, which considers the world to be a family, and sees Indian economic progress as closely interlinked with the progress of the rest of the world.
10 Editor’s note: The issue of corporate leverage and the high proportion of non-performing assets on banks’ balance sheets.
11 https://timesofindia.indiatimes.com/india/incomes-up-since-covid-but-poorest-20-still-below-fy16-level-study/articleshow/107124541.cms?from=mdr (accessed 27 January 2024).

1.jpg)
