
The Extraordinary Development of the Labor Market in the United States during 2020-2023
[Чтобы прочитать русскую версию статьи, выберите русский в языковом меню сайта.]
Natalia Petrovskaya is a senior researcher at the department of economic research of Georgy Arbatov Institute for US and Canada Studies, Russian Academy of Sciences
SPIN RSCI: 4469-9990
ORCID 0000-0002-5954-0656
ResearcherID: GVR-7125-2022
Scopus AuthorID: 57207889454
For citation: Petrovskaya, Natalia, 2023. The Extraordinary Development of the Labor Market in the United States during 2020-2023. Contemporary World Economy. Vol. 1. No 3.
Keywords: labor market, United States, COVID-19, inflation, labor unions.
Abstract
This paper analyzes the labor market in the United States in 2020–2023, with a focus on its unconventional development due to the COVID-19 pandemic. The pandemic resulted in lockdowns and restrictions in various states, which disrupted the traditional business cycle and caused a significant decline in employment, particularly in service industries such as tourism, hospitality, restaurants, and entertainment. The restrictions also impacted consumer spending, resulting in increased savings and pent-up demand. The article analyzes the unemployment trends among various age and racial-ethnic groups and highlights the most challenging segments of the US labor market. It pays special attention to remote work and the changes it brings, such as hybrid work, the rise of Zoom towns, and hiring through digital platforms. The fiscal stimulus of the US government and its implications for the labor market are demonstrated. Additional funding for small businesses has led to record new business start-ups and rapid job growth that has nearly offset the losses associated with COVID-19. Particular attention is paid to inflation, which peaked at 9.1% in June 2022 and the high growth of which is depressing real incomes, forcing people to go to work. The article notes an unusual situation where slow GDP growth is combined with high employment, and that the mechanism behind this phenomenon is yet to be investigated. It cites data from public opinion polls conducted by the Gallup, which reveal the American society’s mood regarding their financial well-being. The article examines the activation of American trade unions, using the United Auto Workers Union’s September 2023 large-scale strike at several plants of the Big Three (General Motors, Ford, Stellantis) as an example.
Introduction
The theoretical foundations of labor processes were established by several economists, including A. Smith, J. Keynes, K. Marx, and A. Pigou. The works of the classics clearly outlined the policy of non-interference of the state in the market economy. However, in his work “The General Theory of Employment,” J. Keynes aimed to demonstrate the fallacy of the classical theory’s postulate that the market economy naturally returns to a state of full employment of resources after temporary shocks. This work was written at a time when the unemployment rate in the capitalist countries of the world reached 25%. The reason outlined for economic crises is the inequitable distribution of wealth and income, which results in a lack of suitable employment opportunities for the population. In other words, the internal causes of crisis situations in the state, including the inability of the economic system to be a self-regulating mechanism, lead to unemployment. J. Keynes’ theory completely refutes the laws of market equilibrium of the classics. For instance, it criticizes the thesis that supply forms demand. State support is proposed as the solution to any crisis problem in the field of labor. This support should be aimed at forming effective demand, which will ensure the utilization of production capacity. The regulation of the economy is proposed through the fiscal sphere. The work describes the expected mechanisms that could function effectively, taking into account the limited factors of impact on the economy from the global environment. It is important to note that J. Keynes did not take into account the issues of technological progress, population migration, and the concentration and specialization of production on a global scale.
In the late 1950s and early 1960s, studies analyzed cyclical behavior and relationships between macro indicators of the labor market. As a result, Phillips curve1 [Phillips 1958] and Beveridge curve [Dow, Dicks-Mireaux 1958] were created, and Okun’s law [Okun 1962] was formulated. These dependencies can be used by the government to conduct monetary policy with confidence [Semenkov 2017].
In 1976, the American economist M. Friedman was awarded the Nobel Prize for his monetarist concept, which is based on classical theory and advocates for a self-regulated economy without state intervention. The theory emphasizes the self-sufficiency of market instruments. Criticism has been directed towards the state’s policy of providing grants and subsidies to support vulnerable segments of the population. This type of support has been shown to be harmful to the economy, as it can lead to an increase in unemployment and dependency on subsidies.
During the late 1970s and early 1980s, several articles were published that examined the negotiation process between employees and employers at the micro level and its impact on macroeconomic indicators in the labor market. One such study was conducted by P. Diamond, who analyzed the effect of the negotiation process between job seekers and employers on fluctuations in the unemployment rate [Diamond 1982]. D. Mortensen and C. Pissarides have both contributed to the understanding of frictional unemployment at the macro level. Mortensen’s explanation centers on the need for workers to maximize their utility in wage negotiations [Mortensen 1982], while Pissarides found a relationship between unemployment, vacancies, and wages in response to positive and negative shocks [Pissarides 1985]. The latter explained that shocks primarily affect microeconomic indicators such as employer’s costs of vacancy and the strength of employee bargaining power, which in turn leads to cyclical fluctuations at the macro level. These studies have stimulated the development of a methodology for collecting data on job dynamics [Davis, Haltiwanger 1992], which has expanded the statistical base of the US Bureau of Labor Statistics. As a result, in 2010 the Nobel Prize in Economics was awarded to P. Diamond, D. Mortensen, and K. Pissarides for their contributions to the methodology and analysis of cyclical fluctuations in the labor market.
The development of employment theories is often divided into two main directions: classicists and monetarists (free market and the formation of the supply of goods) and Keynesians and neo-Keynesians (state control and the creation of a demand market). Other theories criticize either classicism or Keynesianism. However, it is important to consider the challenges of progress faced by the global world.
The employment issues of the 21st century differ from those of the past. It is important to thoroughly review employment issues, considering the impact of new forms of economic activity on social development. For instance, the introduction of new technologies and automation in production processes has significantly altered the employment landscape. These changes are expected to persist due to the rapid pace of scientific and technological progress.
The study of the labor market is a popular topic, as evidenced by the over 27,000 articles found on RSCI2 when searching for the keyword combination “рынок труда” (“labor market”). Interest in this topic is growing, with 2,644 articles published in 2020, 2,753 articles in 2021, and 2,666 articles in 2022. Similarly, a search for the keyword “США” (“USA”) yields approximately 32,000 articles, with an average of about 2,000 articles published per year.
1.The 2020 COVID-19 shock
The period between 2020 and 2023 is marked by numerous unusual phenomena in the business cycle, particularly in the labor market. Understanding the development of the US economy requires consideration of changes in worker behavior, even though the mechanisms and consequences of these changes are only beginning to emerge and be analyzed in scientific literature. In his article titled “The Shocks of 2020-2023 and the Business Cycle,” Prof. L. Grigoryev identifies four shocks that occurred between 2020 and 2023. These include: (1) the COVID-19 pandemic shock in the form of lockdowns and its impact on the healthcare sector; (2) the shock of unique (in scale and time) anti-crisis responses by governments and central banks in 2020–2021, employing fiscal and monetary incentives; (3) an early recovery in the commodity markets and rising raw material prices under (1) and (2) in 2021–2022; and (4) the sanctions shock in 2022 as a global economic issue and the EU energy collapse as a key component of it or as an individual shock [Grigoryev 2023]. It is important to note that each shock had its own unique impact on the economy.
Business cycles in the United States have been observed for almost 170 years, since 1854. GDP level and employment indicators have traditionally been the key factors influencing them. The National Bureau of Economic Research (NBER) Business Cycle Dating Committee identified three cycles in the 21st century, each of which ended in a crisis [NBER 2023]. The latest economic cycle set a new record for duration, lasting 128 months from the recession in June 2009 until February 2020, almost 11 years.
Real consumer spending between 2019 and 2023 exhibits significant fluctuations, as shown in Figure 1. The decline in April 2020 was significant, likely due to the start of the lockdown. In March 2022, there was a sharp increase in real consumer goods, followed by a subsequent decline, another increase, and then a continuation of swings with a smaller amplitude. This situation is not solely due to inflation, but also to the rising prices of food and fuel.
Figure 1: Percent Change from Preceding Period in Prices for Personal Consumption Expenditures by Major Type of Product, Monthly
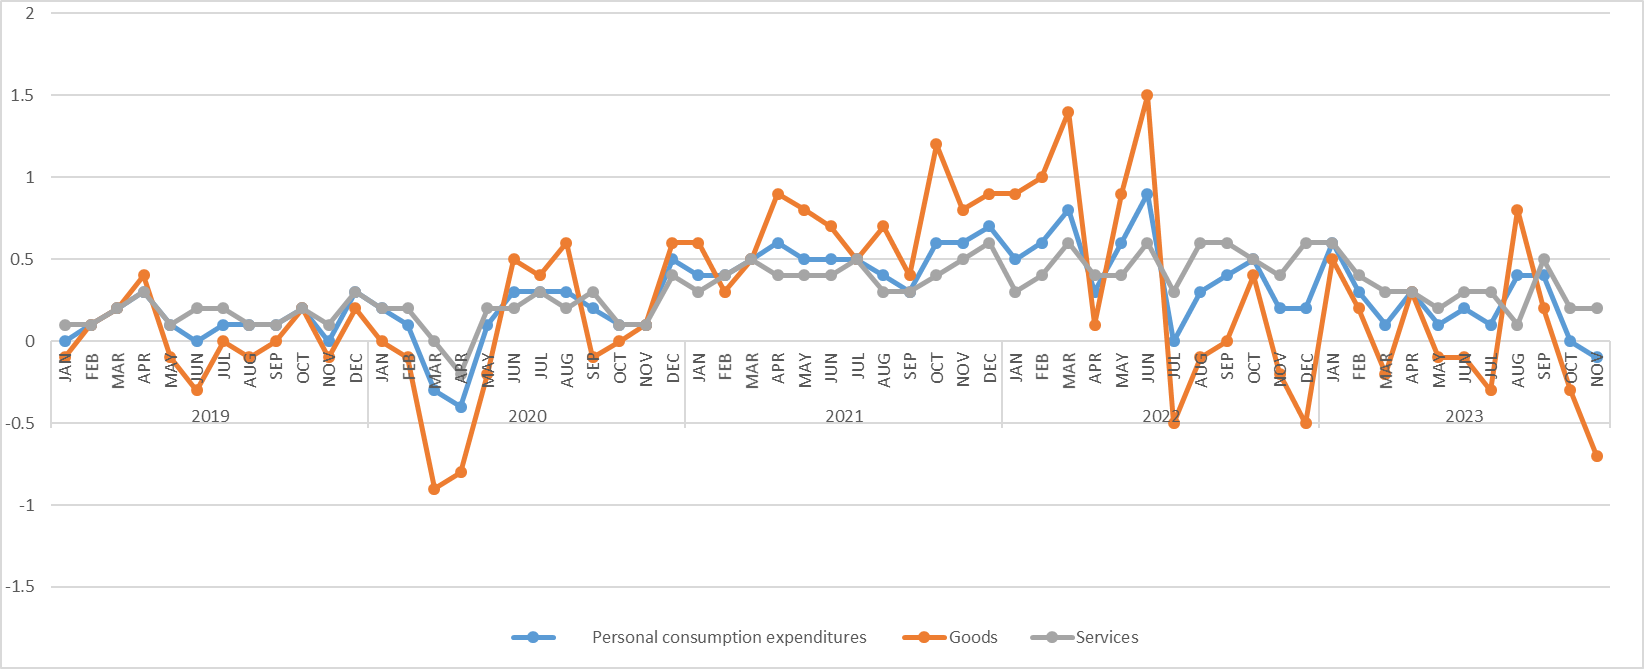
Source: [BEA 2023a].
Speaking at the 75th session of the UN General Assembly, Secretary General António Guterres assessed the consequences of COVID-19: “We face simultaneously an epochal health crisis, the biggest economic calamity and job losses since the Great Depression, and dangerous new threats to human rights” [Guterres 2020].
As of April 1, 2020, the United States Census Bureau reported a population of 331.4 million people. From March 2020 to May 2023, the United States experienced over 104.5 million cases of COVID-19, resulting in more than 1.138 million deaths [CDC 2023]. These numbers are twice the losses suffered by the US in the two World Wars and the Vietnam War combined. The pandemic caused millions of workers to lose their jobs, hundreds of thousands of businesses to cease operations, supply chains to be severed, and schools to close. It is important to note that quarantine measures varied in duration and type across different states. Lockdowns were implemented for the longest period of time in California, New York, and Illinois. Although non-medical disease control measures have been used for centuries, the scale of those implemented in 2020 is considered unprecedented. The introduction of quarantine measures has had profound negative economic consequences and has been met with protests in several regions.
As of September 1, 2023, the US population was 335.3 million. Every 8 seconds a new person is born, every 11 seconds one person dies. The increase in the US population is due to immigration, with a new migrant added every 31 seconds [United States Census Bureau 2023d]. The median age of the population is 38.8 years [United States Census Bureau 2022], with nearly 17% being 65 years or older and just over 22% being children under the age of 18. As of 2022, the working-age population is approximately 264 million. There has been a decline in the participation of Americans in the nation’s labor force. According to BLS (2023a), the participation rate was 67.1% in 2000, 62.9% in 2008, 61.7% in 2020, 61.7% in 2021, and 62.2% (or 164.3 million people) in 2022. This decline is due to both supply and demand factors. The most significant factor reducing participation in recent years has been the aging of the labor force. The oldest members of the baby boomer generation retired at the onset of the global financial crisis. As labor market participation tends to decline with age, an aging population can reduce the proportion of active workers in the total population. This can have an impact on per capita output if not accompanied by capital investment or productivity gains. Strong per capita economic growth has been a major driver of rising living standards in the past century. Therefore, an aging population could have a negative impact on future living standards in the United States [Economic Report of the President 2023]. It is important to consider that the economy can adapt to a reduction in available labor by stimulating productivity.
The COVID-19 pandemic started in early 2020 and proved to be the most dangerous for the elderly. It caused a shock and led to significant changes in the labor market. Since the start of the pandemic, the number of retirements among baby boomers has increased dramatically, as older workers faced new and potentially serious health risks on the job. At the beginning of the pandemic, quarterly retirement rates increased by 5 percentage points, which is a much larger increase than during the financial crisis [McEntarfer 2022]. Retirements increased significantly among workers age of 65 and older, as well as among Whites compared to Blacks and Hispanics, and among those with a college education compared to those without [Montes, Smith, and Dajon 2022]. In response to declining demand, some employers have encouraged early retirement among workers.
The number of claims for unemployment benefits began to rise rapidly as soon as the pandemic began. By the end of March 2020, the number of claims had exceeded 3.28 million, the highest number since 1967 when the US Department of Labor began publishing reports. By the end of April 2020, the number of applications had totaled more than 26 million.
Table 1 presents data on unemployment rates for different age and racial-ethnic groups. In March through April 2020, 38 million Americans had no regular earnings. Unemployment reached its peak in April 2020 at 14.7%, with higher rates for women (15.5%), African Americans (16.8% in May 2020), and Hispanics (18.8%). Unemployment rates for low-educated, low-skilled individuals, Hispanics, African Americans, and the youngest labor market participants have traditionally been significantly higher. This is consistent with global trends and rates for other OECD countries [Petrovskaya 2018].
Table 1: Unemployment dynamics by different age and racial-ethnic groups in the period 2020-2023, %
|
Month |
Share of unemployed, % |
Men, 20 years and older |
Women, 20 years and older |
Young people aged 16 to 19 years |
Whites |
African Americans |
Asians |
Hispanics |
|
2020 |
||||||||
|
January |
3.5 |
3.2 |
3.2 |
12.3 |
3.1 |
6.3 |
3.0 |
4.3 |
|
February |
3.5 |
3.2 |
3.1 |
11.4 |
3.0 |
6.0 |
2.6 |
4.4 |
|
March |
4.4 |
4.1 |
4.0 |
14.1 |
3.9 |
6.8 |
4.2 |
6.0 |
|
April |
14.7 |
13.0 |
15.5 |
32.7 |
14.1 |
16.6 |
14.5 |
18.8 |
|
May |
13.2 |
11.6 |
13.8 |
30.4 |
12.3 |
16.8 |
14.9 |
17.6 |
|
June |
11.0 |
10.1 |
11.2 |
22.4 |
10.0 |
15.4 |
13.7 |
14.5 |
|
July |
10.2 |
9.3 |
10.5 |
19.2 |
9.2 |
14.4 |
11.9 |
12.8 |
|
August |
8.4 |
7.9 |
8.3 |
16.6 |
7.4 |
12.8 |
10.6 |
10.6 |
|
September |
7.9 |
7.4 |
7.8 |
16.0 |
7.0 |
12.1 |
8.9 |
10.4 |
|
October |
6.9 |
6.7 |
6.5 |
13.8 |
6.0 |
10.9 |
7.5 |
8.9 |
|
November |
6.7 |
6.6 |
6.2 |
13.8 |
5.9 |
10.4 |
6.7 |
8.6 |
|
December |
6.7 |
6.4 |
6.3 |
15.8 |
6.1 |
10.0 |
6.0 |
9.3 |
|
2021 |
||||||||
|
January |
6.3 |
6.1 |
6.0 |
14.7 |
5.7 |
9.2 |
6.6 |
8.5 |
|
February |
6.2 |
6.0 |
5.9 |
14.0 |
5.6 |
9.8 |
5.2 |
8.4 |
|
March |
6.1 |
5.9 |
5.7 |
12.8 |
5.4 |
9.6 |
6.0 |
7.7 |
|
April |
6.1 |
6.0 |
5.6 |
11.7 |
5.3 |
9.9 |
5.7 |
7.7 |
|
May |
5.8 |
5.9 |
5.3 |
9.7 |
5.1 |
9.1 |
5.6 |
7.1 |
|
June |
5.9 |
5.9 |
5.5 |
11.2 |
5.2 |
9.2 |
5.7 |
7.2 |
|
July |
5.4 |
5.4 |
5.0 |
10.6 |
4.8 |
8.2 |
5.2 |
6.4 |
|
August |
5.2 |
5.1 |
4.8 |
11.4 |
4.5 |
8.6 |
4.5 |
6.1 |
|
September |
4.8 |
4.7 |
4.3 |
11.2 |
4.2 |
7.8 |
4.2 |
6.2 |
|
October |
4.5 |
4.3 |
4.3 |
11.6 |
4.0 |
7.7 |
4.2 |
5.7 |
|
November |
4.2 |
3.9 |
3.9 |
10.9 |
3.7 |
6.5 |
3.8 |
5.2 |
|
December |
3.9 |
3.6 |
3.6 |
11.0 |
3.3 |
7.0 |
3.8 |
4.8 |
|
2022 |
||||||||
|
January |
4.0 |
3.8 |
3.6 |
10.9 |
3.4 |
6.9 |
3.5 |
4.8 |
|
February |
3.8 |
3.5 |
3.6 |
10.3 |
3.3 |
6.6 |
3.0 |
4.5 |
|
March |
3.6 |
3.4 |
3.3 |
10.1 |
3.2 |
6.2 |
2.8 |
4.2 |
|
April |
3.6 |
3.5 |
3.2 |
10.2 |
3.2 |
5.9 |
3.1 |
4.2 |
|
May |
3.6 |
3.4 |
3.4 |
10.5 |
3.2 |
6.2 |
2.4 |
4.4 |
|
June |
3.6 |
3.4 |
3.3 |
11.0 |
3.3 |
5.9 |
3.0 |
4.3 |
|
July |
3.5 |
3.2 |
3.1 |
11.4 |
3.1 |
6.0 |
2.6 |
4.0 |
|
August |
3.7 |
3.5 |
3.3 |
10.4 |
3.2 |
6.4 |
2.8 |
4.5 |
|
September |
3.5 |
3.3 |
3.1 |
11.3 |
3.1 |
5.9 |
2.5 |
3.9 |
|
October |
3.7 |
3.3 |
3.4 |
11.0 |
3.3 |
5.9 |
2.9 |
4.2 |
|
November |
3.6 |
3.3 |
3.3 |
11.3 |
3.3 |
5.7 |
2.6 |
4.0 |
|
December |
3.5 |
3.1 |
3.2 |
10.4 |
3.0 |
5.7 |
2.4 |
4.1 |
|
2023 |
||||||||
|
January |
3.4 |
3.2 |
3.1 |
10.3 |
3.1 |
5.4 |
2.8 |
4.5 |
|
February |
3.6 |
3.3 |
3.2 |
11.1 |
3.2 |
5.7 |
3.4 |
5.3 |
|
March |
3.5 |
3.4 |
3.1 |
9.8 |
3.2 |
5.0 |
2.8 |
4.6 |
|
April |
3.4 |
3.3 |
3.1 |
9.2 |
3.1 |
4.7 |
2.8 |
4.4 |
|
May |
3.7 |
3.5 |
3.3 |
10.3 |
3.3 |
5.6 |
2.9 |
4.0 |
|
June |
3.6 |
3.4 |
3.1 |
11.0 |
3.1 |
6.0 |
3.2 |
4.3 |
|
July |
3.5 |
3.3 |
3.1 |
11.3 |
3.1 |
5.8 |
2.3 |
4.4 |
Source: [BLS 2023b].
The duration of job search is an important aspect. According to BLS (2023b), the number of long-term unemployed individuals (those who had been out of work for 27 weeks or more) peaked in March 2021 at 4.2 million. As of June 2021, the median job search duration was nearly 32 weeks, while median unemployment peaked in the spring of 2021 at just under 20 weeks. This chronic inability to find work not only affects individuals’ finances but also their psycho-emotional state.
Youth employment is the most problematic segment. Young people face challenges in finding employment due to lack of practical experience and rapidly changing job requirements. The unemployment rate for individuals aged 16-24 is 2-3 times higher than the national average, and they are often the first to lose their jobs during economic downturns. In April 2020, the national unemployment rate peaked at 14.7%, while the rate for young people was 32.7%. Even three years after the pandemic, the overall unemployment rate remains low at 3.5%. However, youth unemployment remains a concern with a rate of 11.3% (see Table 1). It is important to note that unemployment rates for this group are decreasing, but some are still entering lower-paying jobs or jobs that do not match their education. Additionally, approximately 15% of 16-19 year olds in hourly wage employment are paid at or below minimum wage. One of the employment issues faced by this age group is the lack of practical skills gained through education. Additionally, living in small communities with limited job opportunities and no prospects for upward mobility exacerbates the problem. Another issue is the poor development or absence of programs for professional orientation, employment, and training of young people.
In the United States, as is well known, the service sector dominates the manufacturing sector in terms of both contribution to GDP and employment. It was the service sector that was most affected by the pandemic. The greatest number of people lost their jobs due to the lockdowns, leading to a sharp decline in demand for various services [The White House 2021c] (see Figure 2).
Figure 2: Dynamics of employment decline by industry in the period from February 2020 to March 2021, in %
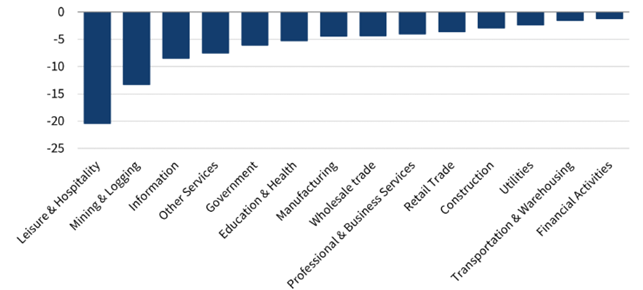
Source: [The White House 2021c].
The pandemic and quarantine measures have led to a rise in flexible forms of employment, with many individuals losing their jobs. According to the International Labour Organization (ILO), 557 million workers worldwide worked from home in the second quarter of 2020, which accounted for 17.4% of global employment. In the United States, 33% of workers reported switching to remote work due to the coronavirus pandemic in May-June 2020, and this number decreased to 22% in Q4 2020, which was still significant [Hassel 2021; Petrovskaya 2022].
During the COVID-19 pandemic, many workers started working remotely for the first time. Research by J.I. Dingel and B. Neiman shows that remote work primarily benefits skilled workers, with wages for remote work being significantly higher. In fact, remote work accounts for 46% of all wages in the United States [Dingel, Neiman 2020]. Expanding on their study, Dey et al. (2021) estimated that the average wage in occupations suitable for telework is $35.22, compared to $20.31 in unsuitable occupations. Additionally, households earning over $100,000 per year are more than twice as likely to work remotely as those earning less than $50,000 per year. Finally, education level also affects the ability to work remotely. The remote work rate for bachelor’s degree holders in remote work suitable occupations was 53%, while the rate for academic degree holders was 62% [Florida, Ozimec 2021]. As of September 2021, 45% of full-time US employees worked partially or fully remotely. This percentage was significantly higher among white-collar workers at 67%, and in education and healthcare, it was 48% and 35%, respectively [Gallup 2021].
Remote workers are often motivated by the satisfaction of certain life needs that can be fulfilled through this type of work organization. Telecommuting has been shown to significantly improve physical and mental health, as well as allow for more time spent with loved ones. Additionally, telecommuting can lead to significant cost savings on fuel, food, and childcare. Finally, many remote workers report increased productivity due to reduced stress from commuting. The estimated time savings due to reduced commute time is in the billions of hours per year.
The shift to telecommuting has led to internal migration, with remote employees moving to find more affordable and spacious housing, resulting in the transformation of small towns and communities into larger cities. These towns, which have seen a significant increase in remote workers, are now commonly referred to as Zoom towns. These are popular vacation destinations and small towns near attractions, such as Aspen (Colorado), Bellevue (Washington), Bethel (Maine), Bozeman (Montana), Cape Cod (Massachusetts), and Carlsbad (California) [Lewis 2023; Petrovskaya 2022]. The population growth in these cities has had significant economic consequences, particularly in the form of rising housing prices.
The COVID-19 pandemic has expedited the transition to on-demand labor hiring models. Due to the increasing gaps in the supply and demand for specialized skills, companies have been compelled to adopt a more innovative approach to workforce management and talent acquisition. The pandemic has also necessitated the acquisition of new management skills by business leaders, including remote team management and adaptability to unpredictable circumstances. Finally, solving the problems during the early months of the COVID-19 rollout led to two unexpected results. First, it forced companies to adapt their traditional ways of surviving a crisis, breaking away from the past. Remote work, previously viewed with suspicion, became the norm. Second, it accelerated companies’ technology adoption, propelling them into the future. Prior to the COVID-19 pandemic, managers were often advised against collaborating with external specialists, including highly skilled freelancers, due to various legal concerns. However, in the wake of the pandemic, companies have become more adept at managing change and implementing contingency plans during crises [Fuller, Raman, and Palano 2020]. As a result, there has been a rise in the number of US companies hiring freelancers through digital labor platforms. Additionally, there is a trend of the Global North outsourcing work to the Global South. The labor market is undergoing a global transformation, which is expanding employment opportunities while also creating challenges for work organization, such as minimum wages, working hours, and social security [Petrovskaya 2021].
It is worth noting that the prevalence of telecommuting varies by occupational field, with some professions being more suitable for remote work than others. For instance, remote work is feasible for programmers, designers, writers, and analysts, as their primary tasks involve computer work and internet access. However, traditional occupations that require physical presence, such as doctors, cooks, daycare providers, or construction workers, cannot be entirely replaced by remote employment. Therefore, the implementation of telecommuting may be restricted in certain occupational fields.
At the beginning of the COVID-19 pandemic, the decrease in labor market participation among working-age individuals was mainly caused by pandemic-related disruptions. Layoffs, illness, and caregiving responsibilities forced many participants out of the labor market [Garcia, Cowan 2022; Goda, Soltas 2022; Cajner et al. 2020]. As businesses and schools reopened and vaccines were introduced, the participation of older adults rebounded quickly [Forsythe, Kahn, Lange, Wiczer 2022; Hansen, Sabia, and Schaller 2022]. Remote employment has enabled individuals with disabilities to increase their labor market participation from pre-pandemic levels [Ne’eman, Maestas 2022]. Despite wage growth, employment growth slowed significantly in the second half of 2022. One of the main factors influencing people’s behavior was the government’s unprecedented fiscal measures, which included direct cash payments. The slowdown in labor supply growth is concerning as it implies a slowdown in economic growth.
Despite the upheaval caused by the COVID-19 pandemic, the US labor market remained tight throughout 2022. For most of the previous year, there were twice as many job openings as there were unemployed individuals, creating an unprecedented gap between labor supply and demand. This shift in power between workers and businesses resulted in a surge in hiring, enabling many workers to switch jobs and careers, with a significant number experiencing substantial wage increases [Economic Report of the President 2023].
2. US government fiscal stimulus in 2020-2021
The COVID-19 pandemic has reduced real GDP as early as the first quarter of 2020. GDP contracted by a record 29.9% in the second quarter, the largest decline in 70 years, followed by an unprecedented 35.3% increase in the third quarter, for a total for 2020 of a 1.5% decline in real GDP (see Table 2).
Table 2: Quarterly GDP dynamics in the United States from Q1 2020 to Q2 2023, %
|
|
GDP |
|
2020 |
|
|
Q1 |
-4.6 |
|
Q2 |
-29.9 |
|
Q3 |
35.3 |
|
Q4 |
3.9 |
|
Total |
-1.5 |
|
2021 |
|
|
Q1 |
6.3 |
|
Q2 |
7.0 |
|
Q3 |
2.7 |
|
Q4 |
7.0 |
|
Total |
5.7 |
|
2022 |
|
|
Q1 |
-1.6 |
|
Q2 |
-0.6 |
|
Q3 |
3.2 |
|
Q4 |
2.6 |
|
Total |
0.9 |
|
2023 |
|
|
Q1 |
2.0 |
|
Q2 |
2.4 |
Source: [BEA 2023b].
In FY 2020, the US government faced a record budget deficit of $3.1 trillion, which accounted for 14.9% of GDP.
To address the crisis, the government implemented a combination of fiscal stimulus and assistance programs for those affected by the pandemic. The 45th Presidential administration, under D. Trump, took several measures to combat the crisis.
- The first aid package, Phase 1 (Coronavirus Preparedness and Response Supplemental Appropriations Act, 2020), was signed into law on March 6, 2020, with a total allocation of $8.3 billion.
- On March 18, 2020, the Families First Coronavirus Response Act (FFCRA) was signed into law as the second aid package (Phase 2), allocating $192 billion, including $1 billion in additional funds for unemployment insurance.
- Also on March 18, 2020, a moratorium on foreclosures and evictions of homeowners whose mortgages were insured was enacted.
- The Coronavirus Aid, Relief, and Economic Security Act (CARES Act), the third and largest aid package in US history, was signed on March 27, 2020. It allocated $2.3 trillion for various activities, including direct cash payments to citizens ($1,200 per person and $500 per child).
- In addition, an extra stimulus package (Phase 3.5) was signed on April 24, 2020. A total of $484 billion has been allocated.
- The tax deadline for both individuals and businesses was extended in March 2020, and interest accrual and student loan payments were also suspended at that time.
- On August 10, 2020, Trump signed four executive orders aimed at providing additional payments to the unemployed, extending the moratorium on student loan payments and interest, offering temporary assistance to homeowners and renters, and deferring taxes for those earning less than $100,000 per year (Lost Wages Assistance (LWA), Student Loan Interest, Temporary Assistance to Homeowners and Renters, and Payroll Tax Deferment).
- The fourth aid package was passed on December 27, 2020, and totaled $915 billion. It included several measures, such as direct payments of $600 for individuals earning less than $75,000 per year, expanded unemployment benefits, and aid for small businesses, among others.
The presidency of the 46th President of the United States, J. Biden, began on January 20, 2021. He inherited a challenging economic situation, including the ongoing COVID-19 pandemic. In the first 100 days of his presidency, he signed 42 executive orders, which is more than any president in the last 75 years.
Biden rescinded executive orders issued by D. Trump that banned citizens of certain Muslim and African countries from entering the US and canceled plans to build a wall on the border with Mexico. In February 2021, the Domestic Policy Council was directed to develop a naturalization program and restore confidence in the legal immigration system. Since the borders opened in late 2021, the number of immigrants, both legal and illegal, has increased. According to the Center for Immigration Studies (CIS), the number of illegal immigrants in January 2022 was 11.35 million. The ongoing debate regarding illegal immigrants and their potential legalization, which could add 11 million individuals to the labor force, continues with varying intensity. The current administration’s relaxed policies have resulted in an increase of over 1.2 million illegal immigrants in the past year. The Center for Immigration Studies has expressed concern, stating that “in a very real sense, America has lost control of its borders” [Camarota 2022].
The American Rescue Plan Act of 2021, a $1.9 trillion stimulus bill signed into law on March 11, 2021, was one of the first major pieces of legislation to address economic problems. Its major accomplishment was the creation of 1 million new jobs in March 2021, bringing unemployment down to 6.1% (refer to Table 1). The Act provided direct cash payments of $1,400 for individuals earning less than $75,000 per year, as well as $1,400 for each dependent. Additionally, payments were provided for individuals earning less than $100,000, but in smaller amounts.
The American Rescue Plan Act provided funding to small businesses, resulting in a significant increase of 5.4 million new businesses opening in 2021, which is 20% higher than the previous several years. In 2021 and 2022, the US experienced record numbers of small business applications and the fastest new job growth in recent years. Job growth in 2021 nearly offset job losses from COVID-19 in 2020.
Another important labor market law is the Infrastructure Investment and Jobs Act. On November 15, 2021, a bipartisan agreement passed the Act, which aims to modernize and repair America’s roads, bridges, and railways, expand access to clean drinking water and broadband internet, and address environmental concerns. The law is expected to create 1.5 million jobs per year over the next decade [The White House 2021a].
Regarding the pandemic and the US government’s support measures, it is noteworthy to mention the Supplemental Nutrition Assistance Program, commonly referred to as SNAP. This program is one of the largest welfare programs in the country and has been in existence for almost 60 years. The amount of assistance households receive under SNAP depends on the number of family members, their age, medical conditions, and the amount of combined monthly income. To be eligible for the program, the total monthly income must not exceed 130% of the federal poverty line. For a family of four in 2023, this amount is $3,007 per month.
The program’s parameters are directly impacted by the level of poverty resulting from the financial crisis, unemployment, and other factors. In March 2020, Congress authorized additional payments and significantly relaxed recipient eligibility requirements due to the COVID-19 quarantine. As a result, the number of recipients immediately began to grow and in September 2020, it reached over 43 million, which is 13% of the nation’s population [USDA 2023]. Despite the passage of more than three years since the pandemic began, the number of food stamp recipients remains high. In April 2023, approximately 42 million individuals in 22.2 million households continued to receive supplementary food assistance.
The pandemic-induced economic downturn resulted in significant job losses, exacerbating the financial situation of low-income individuals. The most vulnerable to COVID-19 were those with limited access to healthcare, low wages, and the inability to work remotely. These individuals faced challenges in obtaining necessary medical care and financial assistance. Simultaneously, the surplus money supply and extensive budgetary expenditures resulted in an increase in stock and housing prices, which greatly benefited wealthier asset owners. According to L. Grigoryev, the affluent class had to forgo their customary lifestyle, including dining out, vacationing, and attending cultural events, as they received additional funds to invest in financial assets and real estate. This income trend and shift in spending patterns evidently exacerbate asset-based inequality [Grigoryev, Grigoryeva 2021. P. 105]. The Federal Reserve System (FRS) report on household wealth shows that the total wealth of the richest 1% reached a record $45.9 trillion at the end of the fourth quarter of 2021. Their fortunes increased by more than $12 trillion, or more than a third, during the pandemic [Federal Reserve Bank of St. Louis 2020].
When critically assessing state policy measures in the labor market during the COVID and post-COVID periods, it is important to note that while the government was able to maintain purchasing power and stimulate investment activity, public debt and inflation increased, leading to rising prices. Additionally, it is worth noting that some individuals are hesitant to return to work when the government is providing financial assistance. However, the increase in prices reduces real income and stimulate the employment. Additionally, direct cash payments may create a dependency among individuals, discouraging them from taking initiative to improve their own financial situation. Therefore, while direct cash transfers may be intended to stimulate the economy and mitigate the effects of economic crises, they can also have negative consequences. It is important to consider alternative solutions and carefully weigh the potential benefits and drawbacks of each option. The labor market situation in 2023 raises several questions for further analysis. The slow GDP growth and high employment were significant outcomes of the extraordinary events of recent years.
3. Market impact on inflation 2021-2022
Huge budgetary injections to support the economy led to a rapid rise in inflation in March 2021. By June 2022, it peaked at 9.1%, the highest rate in 40 years (see Figure 3).
Figure 3: US inflation dynamics between July 2020 and July 2023.
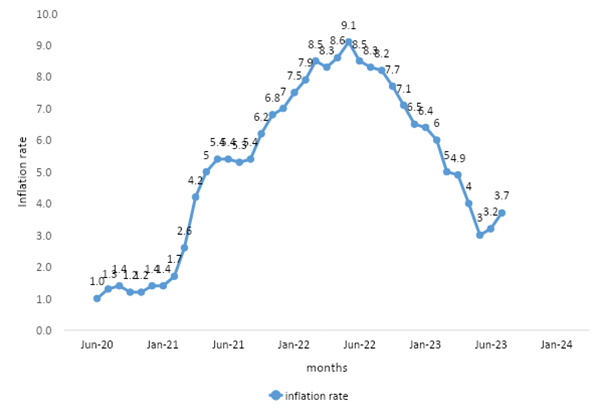
Source: [Statista 2023].
Inflation has become a more significant concern for Americans than it has been in the past three decades. According to a March 2022 Gallup poll, 83% of respondents expressed concern about inflation, with 58% indicating that they were “very concerned” [Gallup 2022]. The percentage of individuals who were “strongly concerned” about inflation was almost as high among those earning $100,000 or more (58%) as among those earning less than $40,000 (63%). By comparison, there is a 44 percentage point difference in concern about inflation between Republicans (79%) and Democrats (35%), with independents (63%) being closer to Republicans.
On August 16, 2022, President J. Biden signed the Inflation Reduction Act into law, which provides $737 billion in appropriations over the next 10 years. The act aims to curb inflation by reducing the budget deficit, lowering prescription drug prices, and investing in domestic energy production. The proposed law claims to create 9 million jobs and save the average American consumer up to $220 per year in energy costs [Carlson 2022]. The White House believes that implementing this law will help reduce the federal budget deficit by $300 billion over the next 10 years and reduce inflation.
To regulate inflationary processes, the Fed began raising the base refinancing rate, increasing it from 0.25% in May 2022 to 5.5% in August 2023. The Fed expects the rate to be at 5.6% by the end of 2023 and 4.6% by the end of 2024 [FRED 2023a].
As the wage trends presented in Table 3 show, average wages in the United States are rising, but at the current rate of inflation, this increase is not enough.
Table 3: Dynamics of labor remuneration in 2007-2022
|
Years |
Average weekly hours |
Average hourly earnings (in current dollars) |
Average weekly earnings (in current dollars) |
|
2007 |
34.4 |
20.92 |
719.74 |
|
2008 |
34.3 |
21.56 |
738.96 |
|
2009 |
33.8 |
22.17 |
749.92 |
|
2010 |
34.1 |
22.56 |
769.57 |
|
2011 |
34.3 |
23.03 |
790.79 |
|
2012 |
34.5 |
23.49 |
809.43 |
|
2013 |
34.4 |
23.95 |
825.08 |
|
2014 |
34.5 |
24.46 |
844.77 |
|
2015 |
34.5 |
25.02 |
864.10 |
|
2016 |
34.4 |
25.64 |
881.09 |
|
2017 |
34.4 |
26.32 |
906.19 |
|
2018 |
34.5 |
27.11 |
936.37 |
|
2019 |
34.4 |
27.99 |
963.06 |
|
2020 |
34.6 |
29.35 |
1,014.38 |
|
2021 |
34.7 |
30.60 |
1,063.08 |
|
2022 |
34.5 |
32.25 |
1,113.99 |
Source: [The White House 2023].
Figure 4 presents the dynamics of real weekly wages since 1980. The presented data shows that wages have remained nearly constant for the past 40 years. This slow and uneven growth is a result of the increasing disparity between productivity growth and the wages earned by the average worker. From 1979 to 2013, hourly wages increased by only 8.2%, while productivity increased by 64.9%. Therefore, labor productivity grew almost eight times faster than hourly wages.
Significant changes in real wage growth occurred between 1995 and 2000, facilitated by the increase in the minimum wage at the end of 1990. The minimum hourly wage was introduced in the United States in 1938 by the Fair Labor Standards Act and was set at 0.25 cents. Most of the increase in minimum hourly wage occurred between 1978 and 2009. The last increase to $7.25 per hour was made on July 24, 2009 and has not been implemented since then.
It should be noted that the wages of the top 1% have been consistently increasing over the past few decades, while the wages of 90% of workers have remained stagnant. In 1965, the wage gap between CEOs and workers was 20 times, but in 2022 it was over 300 times. This indicates a growing income inequality.
Figure 4: Trends in real weekly wages in 1980–2023 (in constant 1982–1984 dollars)
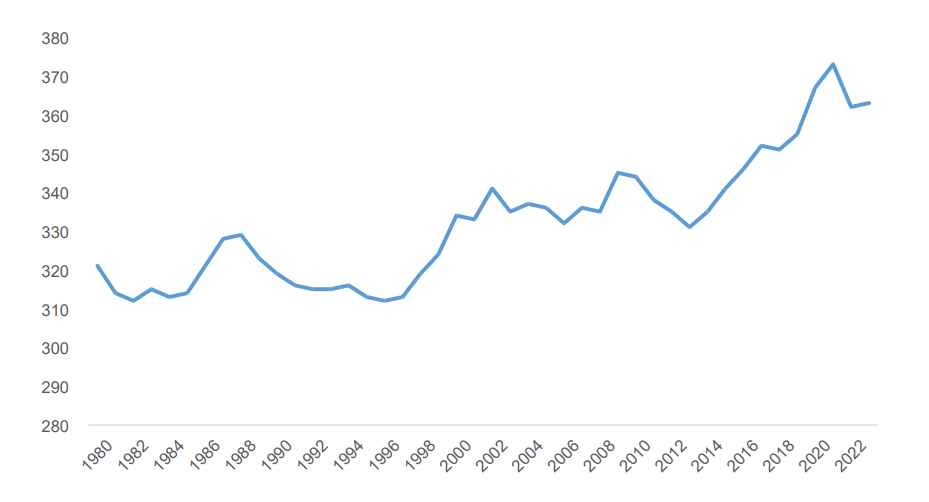
Source: [FRED 2023b].
According to Gallup polls, in May 2023, 50% of respondents believed that their financial situation was worsening, while 37% believed it was improving [Gallup 2023]. These views are generally consistent with past polls, but contrast with the 2021 data, when Americans were optimistic about their finances (see Figure 5).
Figure 5: A public opinion poll on the financial health of Americans
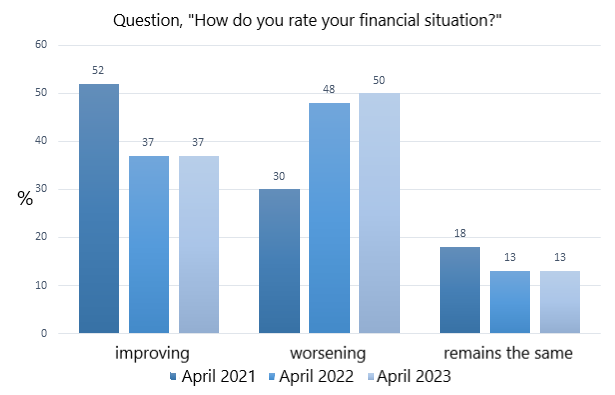
Source: [Gallup 2023].
The key financial problem Americans cite is inflation. Although inflation has declined over the past year, it is still higher than before the pandemic, and food and gasoline prices remain high. Americans’ concerns about maintaining their standard of living, paying monthly bills, covering housing costs, and saving for retirement are increasing, not decreasing (see Figure 6).
Figure 6: Dynamics of changes in Americans’ public perceptions of their concern about financial issues in 2001–2023
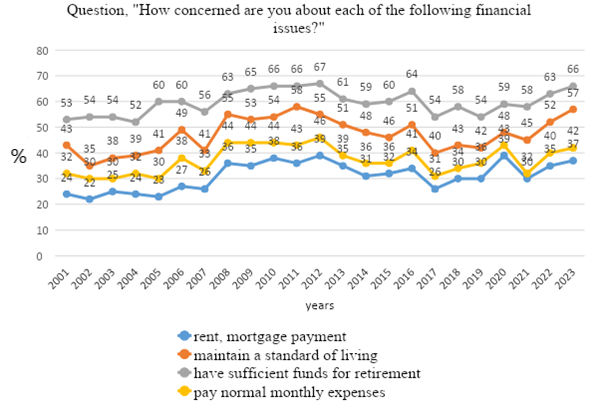
Source: [Gallup 2023].
As usual, there are sharp differences in how families of different income levels rate their financial situation and comfort level. Satisfaction among low- and middle-income Americans reaches a new low in 2023 (see Figure 7).
Figure 7: Dynamics of changes in the public opinion of Americans of different income levels about their financial situation in 2002–2023
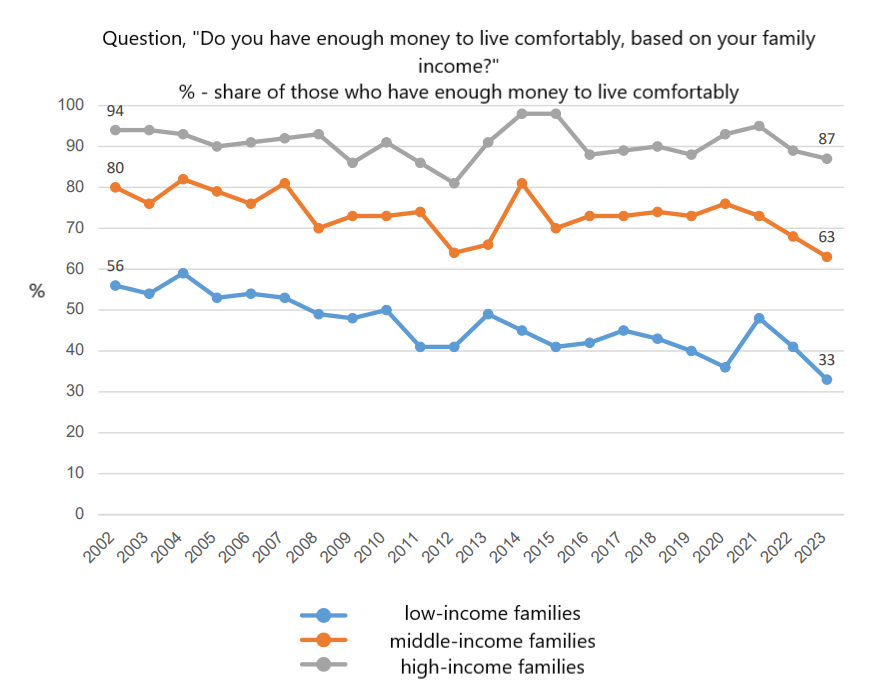
Source: [Gallup 2023].
Income inequality in the United States has risen sharply since the 1970s. Between 1979 and 2019, a 40-year period, inequality increased by 25 percent [CBO 2022] (see Table 4).
Table 4: Household income in the US (over 15 years old, thousand dollars/family) in 2022
|
Household income |
Population |
White (non-Hispanics) |
Asians |
Hispanics |
African Americans |
|
Median income |
74 |
81 |
109 |
63 |
53 |
|
Median family income after taxes |
64 |
67 |
90 |
56 |
47 |
Source: [United States Census Bureau 2023b].
The income disparity is closely tied to race. Asian citizens have the highest income levels, while African American and Hispanic households in the US have approximately half the median income of Asian households. According to the 2019 Federal Reserve Board survey, the average white household has 10 times more wealth than the average black household. Additionally, the 400 wealthiest American billionaires possess more total wealth than all 10 million black households combined.
The number of middle-income families in the US continues to decline. The middle class was formed from the end of World War II through 1970. However, since then, despite the continued growth of the US economy, the middle class has significantly shrunk. Figure 8 illustrates the transformation of household income, showing the sharp decline of the middle class and the growth of households with incomes of $150,000 per year and above. As of 2022, there are 131.4 million households3 in the United States.
Figure 8: Distribution of households by income in 1970, 2000, and 2023, %
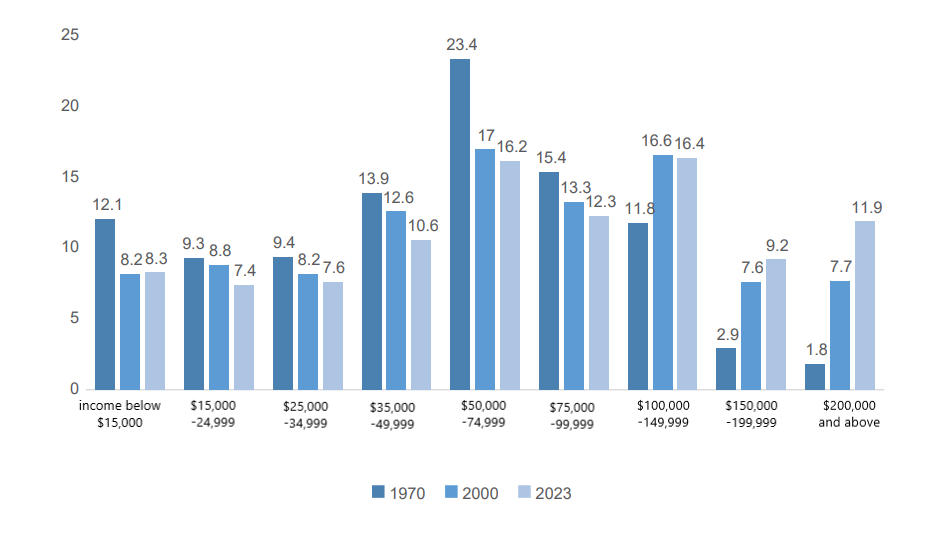
Source: [United States Census Bureau 2023b].
The data presented shows that the percentage of households with incomes between $50,000 and $100,000 per year decreased from 38.8% in 1970 to 28.5% in 2023. In contrast, the percentage of households with incomes of more than $150,000 increased significantly from 4.7% to 21.1%, indicating a clear polarization of society.
It is noteworthy that in the United States, 11.5% of the population, or 37.9 million people, live below the poverty line. The poverty line for one person in 2022 was $15,225, for two people was $19,597, and for a family of four was $30,186 per year. Emergency one-time payments from the budget have been a significant support for the population. Although the proportion and size of the population with income below the poverty threshold increased from 2019 (33.9 million), it remained lower than in 2018 (38.1 million) [United States Census Bureau 2023a].
As of April 2022, the homeownership rate stood at 65%4 [United States Census Bureau 2023c]. In the first quarter of 2022, the fixed mortgage rate was 4%, and the median home price was $368,000. To purchase a home, the median household income would need to be $76,000, which is nearly $9,000 higher than the national median income. Due to the widening income gap in the United States, many people find the rental market to be a more appealing option, especially as prices gradually decrease.
4. Trade union activity in the context of labor market recovery
Labor unions in the United States have a long history of advocating for workers’ rights. The first labor unions emerged in the late 18th century and became a powerful political and social movement in the first half of the 20th century. By the late 1940s and early 1950s, the two largest labor unions were the American Federation of Labor and Congress of Industrial Organizations, which represented over 22% of all workers and employees in the country. Over the past 70 years, the membership of American labor unions has declined, with only about 10% of workers being members in 2020. This decline is attributed to the anti-union policies of the authorities and businesses.
However, the processes taking place in American society in the third decade of the 21st century are changing this trend. A striking example of this change is the situation in the fall of 2023 in the auto industry. On September 14, 2023, the United Auto Workers (UAW) union5 initiated a strike that involved over 10,000 workers across three auto plants owned by General Motors (GM’s midsize truck plant in Wentzville, Missouri), Ford (Ford plant in Bronco, Michigan), and Stellantis (Jeep plant in Toledo, Ohio).
The UAW has a long history of accomplishments. In 1950, the UAW reached an agreement with General Motors for employee pensions, wage indexing, and subsidized health insurance. An agreement was also reached in 1955 for additional severance pay upon layoff. The union secured many other important benefits for workers. However, no significant labor improvements have occurred in the last 10 years in the so-called Big Three (General Motors, Ford, Stellantis). In the autumn of 2023, the contracts between the union and the Big Three, which concern 150,000 workers, expired. The union was unable to reach an agreement with the auto companies, resulting in a strike. It is noteworthy that the factories where the strike began are critical to the production of some of the Big Three’s most profitable cars. A strike against all three companies simultaneously is unprecedented in the union’s history.
The union, led by Shawn Fain, made several demands including wage increases, reduction of working hours from 40 to 32 hours per week, indexation of pensions (the last increase was in 2003), increased paid vacation, the right to strike in connection with plant closures, and payments to laid-off workers for public works (Working Family Protection Program) in the event of plant closures. According to representatives of the automakers, fulfilling the requirements would cost $80 billion. They argue that renewing the contract would jeopardize the very existence of the companies and claim that it cannot be implemented.
The current bargaining tactics differ from previous ones. The union is promoting maximum openness by publishing video messages on its official website and social media, and communicating its position to union members and the Big Three. The union leadership cites statistics on lost profits, including an estimated $10.7 billion revenue loss due to production cuts of 280,000 vehicles, a $3.4 billion decrease in profits, and a drop in profitability (EBIT-Adj Margins) from 10% to 7.7% [UAW 2023].
Additionally, the US auto industry employs approximately 1.013 million people with an average hourly wage of $27.18. It should be noted that there is a two-tier system of remuneration, with different rates for permanent and temporary workers. Individuals are typically hired as temporary workers and may work in this capacity, with lower wages, for 10-12 years before being offered permanent full-time employment.
The union leadership has called for a strike due to the significant wage gap between the Big Three management and the workers (refer to Table 5). They believe it is necessary to change the terms of cooperation.
Table 5: Ratio of Big Three CEOs’ earnings to median plant worker wages in 2021 and 2022
|
|
General Motors |
Ford |
Stellantis |
|
|
М. Barra (CEO since January 2014) |
J. Farley (CEO from October 2020) |
C. Tavares (CEO from January 2021) |
|
Compensation amount for 2021, $ mln |
29.1 |
22.8 |
21 |
|
Ratio to median employee salary |
420:1 |
356:1 |
328:1 |
|
Compensation amount for 2022, $ mln |
29 |
21 |
24.8 |
|
Ratio to median employee salary |
362:1 |
281:1 |
365:1 |
Source: [UAW 2023].
Over the past 3.5 years, US inflation has increased by 18.3%, while wage increases in the auto industry have only reached 6.1%.
It is worth noting that over 100 years ago, in 1914, H. Ford raised a worker’s wage to $5 per day, which enabled the latter to purchase his own Model T automobile after 16 weeks of work. This initiative became a crucial factor in the economic growth of the US and the formation of a consumer society. The median salary of a worker at the Big Three is currently around $52,000 per year. The crossovers they produce are sold at prices starting from $55,000.
The state’s current focus is on “green energy” and the development of electric vehicles, which is why subsidies are being allocated, including for the opening of battery production plants. Currently, five plants have been opened, and approximately twenty more are planned. The country is currently transitioning to electric cars, with dozens of plants being built. The union’s objective is to ensure worker protection and improve working conditions. Currently, workers are offered $16.5 per hour with the potential for an increase to $20 per hour over the next seven years. The union representatives argue that this is unjust and inequitable, as companies receive billions of dollars in government subsidies (which are, in fact, funded by these very employees’ taxes) to carry out this large-scale transition.
One of the primary objectives of the union and Big Three negotiations is to ensure that the transition to electric vehicles does not further undermine the standards of workers in the auto industry.
A significant event occurred when President J. Biden arrived at the strike and expressed his support for it. In early November 2023, following a six-week strike, the union tentatively reached agreements with all three of the Big Three, resulting in record wage increases for workers and several other improvements.
It is important to note that in 2023, the National Labor Relations Board (NLRB) issued two landmark decisions to protect unionization rights.
(1) If a majority of a company’s employees join a union and the employer has not filed a request with the National Labor Relations Board for a unionization vote, the union is automatically considered active. Previously, it was the workers’ responsibility to arrange a vote, which employers could sabotage in every way possible. Now, however, it is the employer’s responsibility to challenge the union. If the employer fails to do so, the union is automatically considered effective.
(2) If an employer engages in any form of union-busting, such as unlawfully firing union organizers, during a vote for a union, the union is considered active. This has been a common occurrence in almost every such election over the past forty years. The National Labor Relations Board will require the employer to immediately recognize the union and enter negotiations.
In the United States, the process for forming a union has shifted from permissive to notification-based. If a majority of employees have received membership cards, the union becomes active and the employer is obligated to negotiate with it.
If an employer wishes to prevent the formation of a union without a vote, they must file a request with the National Labor Relations Board. If the employer attempts to prevent a vote in any way, the union becomes active, and the employer must negotiate with it. This decision is a significant victory for the labor movement, comparable to F.D. Roosevelt’s New Deal. The labor movement has reemerged after an absence of nearly a century from the historical process [Meyerson 2023].
Conclusion
In 2023, the US labor market faces challenges such as skills shortages, wage inequality, and rising wages due to low unemployment and a high vacancy rate. When unemployment is low, workers may demand higher wages, leading to increased costs for businesses and higher inflation. Additionally, worker motivation is another important factor to consider. When companies struggle to fill vacancies, they may end up hiring less motivated workers, which can negatively impact productivity and work quality.
The COVID-19 pandemic has caused instability and uncertainty in the US labor market from 2020 to 2023. In summary, the following key deviations can be highlighted:
- Lockdowns implemented in the spring of 2020 have limited spending on services, resulting in savings and pent-up demand.
- Direct cash payments did create a sense of financial stability and reduced the desire to work (until they were eliminated).
- However, due to high inflation, the real incomes of the population are decreasing, forcing people to seek employment. This has resulted in a situation of low unemployment but slow GDP growth, the nature of which requires further study.
- The COVID-19 pandemic has accelerated the shift to remote work, which has in turn facilitated the transition to hybrid work for many organizations. Questions have arisen regarding the certification of remote workplaces and occupational health and safety. These labor market transformations may lead to the abandonment of many office buildings.
- The rise of digital labor platforms is transforming the labor market, as companies in the Global North seek to cut costs by hiring workers from the Global South.
- Government fiscal policies aimed at supporting small businesses have led to the creation of numerous new enterprises and jobs.
- After 80 years, labor unions are experiencing a resurgence in strength. It is suggested that they will be able to exert influence on employers and advocate for higher wages and social protections. This includes support from the current Biden-Harris administration [The White House 2021b].
Bibliography
ApolloTechnical, 2022. Statistics on Remote Workers That Will Surprise You. Available at: https://www.apollotechnical.com/statistics-on-remote-workers/#2-what-percentage-of-jobs-are%C2%A0-remote-%C2%A0
BEA (Bureau of Economic Analysis), 2023a. National Income and Product Account. Table 2.8.7. Percent Change from Preceding Period in Prices for Personal Consumption Expenditures by Major Type of Product, Monthly. Available at: https://apps.bea.gov/iTable/?reqid=19&step=3&isuri=1&1921=survey&1903=84#eyJhcHBpZCI6MTksInNN0ZXBzIjpbMSwyLDMsM10sImRhdGEiOltbIk5JUEFfVGFibGVfTGlzdCIsIjg0Il0sWyJDYXRlZ29yaWVzIiwiU3VydmV5Il0sWyJGaXJzdF9ZZWFyIiwiMjAxOSJdLFsiTGFzdF9ZZWFyIiwiMjAyMyJdLFsiU2NhbGUiLCIwIl0sWyJTZXJpZXMiLCJNIl1dfQ
BEA (Bureau of Economic Analysis), 2023b. National Income and Product Account. Table 1.1.1 Percent Change From Preceding Period in Real Gross Domestic Product. Available at: https://apps.bea.gov/iTable/?reqid=19&step=2&isuri=1&categories=survey#eyJhcHBpZCI6MTksInN0ZXBzIjpbMSwyLDNdLCJkYXRhIjpbWyJjYXRlZ29yaWVzIiwiU3VydmV5Il0sWyJOSVBBX1RhYmxlX0xpc3QiLCIxIl1dfQ==
BLS (Bureau of Labor Statistics), 2023a. The Employment Situation — February 2023. Available at: https://www.bls.gov/news.release/archives/empsit_03102023.pdf
BLS (Bureau of Labor Statistics), 2023b. Overview of BLS Statistics on Unemployment. Available at: https://www.bls.gov/bls/unemployment.htm
Cajner, T., Crane, L. D., Decker, R. A., Grigsby, J., et al., 2020. The U.S. Labor Market during the Beginning of the Pandemic Recession. NBER Working Paper 27159. Available at: https://doi.org/10.3386/w27159
Camarota, S., 2022. America Has Lost Control of Its Borders. Center for Immigration Studies. June 6. Available at: https://cis.org/Oped/America-has-lost-control-its-borders
Carlson, T., 2022. New Climate Law Has Bipartisan Roots — We Need Leadership from Both Parties to Realize Its Potential. Available at: https://thehill.com/opinion/energy-environment/3618019-new-climate-law-has-bipartisan-roots-we-need-leadership-from-both-parties-to-realize-its-potential/
CBO (Congressional Budget Office), 2022. The Distribution of Household Income, 2019. Available at: https://www.cbo.gov/system/files/2022-11/58353-HouseholdIncome.pdf
CDC (Centers for Disease Control and Prevention), 2023. COVID Data Tracker. Atlanta, GA: U.S. Department of Health and Human Services. Available at: https://covid.cdc.gov/covid-data-tracker/#maps_deaths-total
Davis, S., Haltiwanger, J., 1992. Gross Job Creation, Gross Job Destruction, and Employment Reallocation. The Quarterly Journal of Economics, Vol. 107, Issue 3, August. Available at: https://doi.org/10.2307/2118365
Dey, M., Frazis, H., Piccone, D., Loewenstein, M., 2021. Teleworking and lost work during the pandemic: new evidence from the CPS. BLS (Bureau of Labor Statistics). Available at: https://doi.org/10.21916/mlr.2021.15
Diamond, P. A., 1982. Aggregate Demand Management in Search Equilibrium. Journal of Political Economy. No 90 (5). P. 881-894. Available at: http://www.jstor.org/stable/1837124
Dingel, J. I., Neiman, B., 2020. How Many Jobs Can Be Done at Home? NBER Working Paper No. 26948. Available at: https://www.nber.org/system/files/working_papers/w26948/w26948.pdf
Dow, J. C. R., Dicks-Mireaux, L. A., 1958. The Excess Demand for Labor. A Study of Conditions in Great Britain, 1946-56. Oxford Economic Papers. No 10 (1). P. 1-33. Available at: http://www.jstor.org/stable/2661871
Economic Report of the President, 2023. Available at: https://www.whitehouse.gov/wp-content/uploads/2023/03/erp-2023.pdf
Federal Reserve Bank of St. Louis, 2022. Has Wealth Inequality in America Changed over Time? Here Are Key Statistics. Available at: https://www.stlouisfed.org/open-vault/2020/december/has-wealth-inequality-changed-over-time-key-statistics
Florida, R., Ozimec, A., 2021. How Remote Work Is Reshaping America’s Urban Geography. The Wall Street Journal. Available at: https://www.wsj.com/articles/how-remote-work-is-reshaping-americas-urban-geography-11614960100
Forsythe, E., Kahn, L., Lange, F., Wiczer, D., 2022. Where Have All the Workers Gone? Recalls, Retirements, and Reallocation in the COVID Recovery. NBER Working Paper No. 30387. Available at: https://www.nber.org/system/files/working_papers/w30387/w30387.pdf
FRED, 2023a. Federal Funds Target Range — Upper Limit. Available at: https://fred.stlouisfed.org/series/DFEDTARU
FRED, 2023b. Employed Full Time: Median Usual Weekly Real Earnings: Wage and Salary Workers: 16 Years and Over. Available at: https://fred.stlouisfed.org/series/LES1252881600Q
Fuller, J., Raman, M., Palano, J., et al., 2020. Building the On-Demand Workforce. Harvard Business School, BCG. Available at: https://www.hbs.edu/managing-the-future-of-work/Documents/Building_The_On_Demand_Workforce.pdf
Gallup, 2021. Top U.S. Insights from Gallup in 2021. Available at: https://news.gallup.com/opinion/gallup/358421/top-insights-gallup-2021.aspx
Gallup, 2022. Inflation Dominates Americans’ Economic Concerns in March. Available at: https://news.gallup.com/poll/391220/inflation-dominates-americans-economic-concerns-march.aspx
Gallup, 2023. Americans Remain Discouraged About Personal Finances. Available at: https://news.gallup.com/poll/506012/americans-remain-discouraged-personal-finances.aspx
Garcia, K. S., Cowan, G.B., 2022. The Impact of U.S. School Closures on Labor Market Outcomes during the COVID-19 Pandemic. NBER Working Paper No. 29641. Available at: https://www.nber.org/papers/w29641
Goda, G. S., Soltas, E., 2022. The Impacts of COVID-19 Illnesses on Workers. NBER Working Paper No. 30435. Available at: https://papers.ssrn.com/sol3/papers.cfm?abstract_id=4216221
Grigoryev, L.M., 2023. The Shocks of 2020-2023 and the Business Cycle. Contemporary World Economy. Vol. 1. No 1. Available at: https://doi.org/10.17323/2949-5776-2023-1-1-8-32
Grigoryev, L.M., Grigorieva, N.L., 2021. U.S. Economy and Social Structure Before the Change of Eras. Voprosy Ekonomiki. No 1. P. 98-119. Available at: https://doi.org/10.32609/0042-8736-2021-1-98-119 (in Russian).
Guterres, A., 2020. Address to the Opening of the General Debate of the 75th Session of the General Assembly. September 22. Available at: https://www.un.org/sg/en/content/sg/speeches/2020-09-22/address-the-opening-of-the-general-debate-of-the-75th-session-of-the-general-assembly
Hansen, B., Sabia, J., Schaller, J., 2022. Schools, Job Flexibility, and Married Women’s Labor Supply. NBER Working Paper No. 29660. Available at: https://www.nber.org/papers/w29660
Hassel, A., 2021. Teleworking can make work more balanced — but it needs a sound regulatory framework. Available at: https://www.oecd-forum.org/posts/eleworking-can-make-work-more-balanced-but-it-needs-a-sound-regulatory-framework
Lewis, M. W. What Is a Zoom Town? GeoCurrents. Available at: https://www.geocurrents.info/population-geography/migrations/what-is-a-zoom-town
McEntarfer, E., 2022. Older Workers, Retirement, and Macroeconomic Shocks. Available at: https://papers.ssrn.com/sol3/papers.cfm?abstract_id=4169082
Meyerson, H., 2023. Biden’s NLRB Brings Workers’ Rights Back from the Dead. The American Prospect. Aug. 28. Available at: https://prospect.org/labor/2023-08-28-bidens-nlrb-brings-workers-rights-back/
Montes, J., Smith, C., Dajon, J., 2022. “The Great Retirement Boom”: The Pandemic-Era Surge in Retirements and Implications for Future Labor Force Participation. Available at: https://www.federalreserve.gov/econres/feds/files/2022081pap.pdf
Mortensen, D., 1982. Property Rights and Efficiency in Mating, Racing, and Related Games. American Economic Review. No 72. P. 968-979.
NBER (National Bureau of Economic Research), 2023. US Business Cycle Expansions and Contractions. Available at: https://www.nber.org/research/data/us-business-cycle-expansions-and-contractions
Ne’eman, A., Maestas, N., 2022. How Has COVID-19 Impacted Disability Employment? NBER Working Paper No. 30640. Available at: https://www.nber.org/papers/w30640
Okun, A. M., 1962. Potential GNP, Its Measurement and Significance. Cowles Foundation. Yale University.
Petrovskaya, N.E., 2018. U.S. Unemployment: Trends and Structural Peculiarities. Regional Economics: Theory and Practice. No 8 (455). P. 1445-1456. Available at: https://doi.org/10.24891/re.16.8.1445 (in Russian).
Petrovskaya, N.E., 2021. Digital Platforms as the Dominant Vector of the Global Labor Market Development. Upravlenie / Management. 2021. Vol. 9. No 2. P. 103-113. Available at: https://doi.org/10.26425/2309-3633-2021-9-2-103-113 (in Russian).
Petrovskaya, N.E., 2022. Development of Flexible Forms of Employment in the USA. Economics and Entrepreneurship. No 9 (146). P. 131-136. Available at: https://doi.org/10.34925/EIP.2022.146.9.022 (in Russian).
Phillips, A. W., 1958. The Relation Between Unemployment and the Rate of Change of Money Wage Rates in the United Kingdom, 1861-1957. Economica. Vol. 25. Issue 100. Available at: https://doi.org/10.1111/j.1468-0335.1958.tb00003.x
Pissarides, C. A., 1985. Short-Run Equilibrium Dynamics of Unemployment, Vacancies, and Real Wages. The American Economic Review. No 75 (4). P. 679-690. Available at: http://www.jstor.org/stable/1821347
Semenkov, A.V., 2017. Cycles in The Russian Labor Market: Theoretical Aspect of the Analysis. Bulletin of Moscow University. 2017. Ser. 6. No 6. P. 125-142 (in Russian).
Statista, 2023. Monthly 12-Month Inflation Rate in the United States from August 2020 to August 2023. Available at: https://www.statista.com/statistics/273418/unadjusted-monthly-inflation-rate-in-the-us/
The White House, 2021a. Fact Sheet: The Bipartisan Infrastructure Deal. Available at: https://www.whitehouse.gov/briefing-room/statements-releases/2021/11/06/fact-sheet-the-bipartisan-infrastructure-deal/
The White House, 2021b. Statement by President Joe Biden on the House Taking Up the PRO Act. Available at: https://www.whitehouse.gov/briefing-room/statements-releases/2021/03/09/statement-by-president-joe-biden-on-the-house-taking-up-the-pro-act/
The White House, 2021c. The employment situation in March 2021. Available at: https://www.whitehouse.gov/cea/written-materials/2021/04/02/the-employment-situation-in-march/
The White House, 2023. Hours and earnings in private nonagricultural industries, 1977-2022. Table B-30. Available at: https://www.whitehouse.gov/wp-content/uploads/2023/03/erp-2023.pdf
UAW (United Auto Workers), 2023. Available at: https://uaw.org/
United States Census Bureau, 2023a. Poverty in the United States: 2022. Available at: https://www.census.gov/content/dam/Census/library/publications/2023/demo/p60-280.pdf
United States Census Bureau, 2023b. Income in the United States: 2022. Available at: https://www.census.gov/content/dam/Census/library/publications/2023/demo/p60-279.pdf
United States Census Bureau, 2023c. Quarterly residential vacancies and homeownership, second quarter 2023. Available at: https://www.census.gov/housing/hvs/files/currenthvspress.pdf
United States Census Bureau, 2023d. U.S. and World Population Clock. Available at: https://www.census.gov/popclock/
United States Census Bureau. Data, 2022. Available at: https://data.census.gov/profile/United_States?g=010XX00US
USDA (U.S. Department of Agriculture), 2023. Supplemental Nutrition Assistant Program Participation and Costs. Available at: https://www.fns.usda.gov/pd/supplemental-nutrition-assistance-program-snap
Notes
1 For a certain period of time, the Phillips curve became a reference point for politicians in choosing the economic policy of the state (1960s). Moreover, criticism of the theory began already in the 1970s.
2 Russian Science Citation Index, a bibliographic database of scientific publications in Russian.
3 A household is a statistical unit; according to the United States Census Bureau, the average number of people in households was about 2.55.
4 Share of owner-occupied houses.
5 The union of the automotive, aerospace and agricultural workers in the United States.

1.jpg)
