
US Emissions and Climate Policy: National and State Trends
[Чтобы прочитать русскую версию статьи, выберите русский в языковом меню сайта.]
Marianna Esayan — an independent researcher and a graduate of the World Economics Bachelor’s program, Faculty of World Economy and International Affairs, HSE University.
ORCID: 0009-0000-3684-1344
For citation: Esayan, M., 2024. US Emissions and Climate Policy: National and State Trends. Contemporary World Economy, Vol. 2, No 3.
Keywords: greenhouse gas emissions, sustainable development, economic growth, regional breakdown, GDP per capita, United States.
Abstract
Despite the United States’ active involvement in the global climate agenda, the country remains the second-largest greenhouse gas emitter globally, as well as the second-largest producer and consumer of energy. The nation’s climate policies are characterized by instability and variation due to alternating presidential administrations with different political affiliations. In this context, it becomes relevant to explore the regional aspects of the US decarbonization, as well as the influence of regional features on overall GHG emissions. The distinctive characteristics of the United States’ territory are fundamental in assessing the success of decarbonization efforts, which can only be achieved through a well-balanced and evenly distributed approach.
While significant progress has been made toward adopting RES, the speed and nature of this transition vary significantly across different states, resulting in a fragmented national landscape. Regional disparities in economic priorities and access to energy resources often outweigh the influence of political alignment, with neither economic growth nor party affiliation having a decisive impact on reducing emissions. This reflects a historical trend in which emissions reductions are driven more by natural resources and power and industrial technologies rather than by climate policies. Thus, the overall challenge remains: the slow and unambitious approach taken by the nation and its states in their climate actions.
Introduction
Over the past several decades, US policy has evolved from a focus on general environmental protection to a more specific emphasis on climate change mitigation. In the early stages, environmental policies primarily encompassed regulations aimed at protecting natural resources, ecosystems, and public health. However, with the increase in relevance of the climate agenda, climate policies have emerged as a distinct area of policymaking, aimed at mitigating climate change by reducing emissions, transitioning to renewable energy sources, and promoting energy efficiency.
In the context of the significant shifts in US climate policy, including the withdrawal from the Paris Agreement and subsequent re-entry, changes in the political parties in power, and various institutional transformations at the state level, it is important to examine the milestones of US participation in climate governance and the formation of intrastate legislations. Exploring the regional features that influence this process, from economic interests to political affiliations, will provide valuable insights into the challenges and opportunities associated with achieving successful and equitable decarbonization.
Therefore, the purpose of this article is to conduct a comprehensive analysis of decarbonization strategies and greenhouse gas emission trends in the United States, both at the national and state levels. Given the decentralized nature of the US governance structure, where individual states have significant autonomy in shaping their own climate and environmental policies, we assume that the effectiveness of national decarbonization efforts will depend heavily on state-level actions. Consequently, the work raises the question of whether state-level greenhouse gas emissions patterns are primarily shaped by the cumulative effects of natural economic and energy trends, rather than being driven by political party affiliation or short-term policy decisions. The findings from this study will offer valuable insights into the trajectory of federal efforts, illustrating how national strategies might adapt to the diverse landscape of state-level actions.
This work describes the key components of US climate and energy policies and greenhouse gas emission trends, structured into two main sections. The first part examines the national climate policy framework, tracing its evolution from early recognition of climate issues through various presidential administrations up to the current policies under President Biden. This section highlights the interplay between political shifts and the continuity or disruption of climate initiatives, demonstrating how federal policies have shaped the nation’s approach to decarbonization and the adoption of renewable energy sources. The second section focuses on state-level emission patterns, analyzing the impact of regional characteristics, such as energy profiles, economic structures, and local policies and political ideologies, on decarbonization efforts. This part emphasizes the role of states in driving progress in terms of national decarbonization, given the decentralized nature of US governance.
1. Evolution of the United States’ federal approach to climate policy
The energy transition in the US represents a pivotal shift from traditional nonrenewable resources towards renewable alternatives, a process that has implications for environmental conservation, community development, and economic sustainability. One of the main difficulties in establishing a sustainable climate policy is the frequent changes in the governing parties, since the US climate policies are characterized by instability and variation due to alternating presidential administrations with different political affiliations.
Generally, the Democratic Party advocates for comprehensive action on climate change, emphasizing the need for RES, the reduction of GHG emissions, and the implementation of policies aimed at mitigating climate impacts. Conversely, the Republican Party often prioritizes economic growth and energy independence, expressing concerns that aggressive climate policies might hinder economic performance or lead to job losses in traditional energy sectors like coal, oil, and natural gas.
Table 1 presents key stages in the development of US climate policy, highlighting a complex and often inconsistent approach shaped by shifting political and economic priorities. Overall, the pre-Obama era of US climate policy reveals a pattern of incremental progress overshadowed by economic and political constraints, with limited long-term commitment to comprehensive emissions reductions.
Table 1. US climate policy prior to the Obama administration.
|
Stage |
Major Events |
|
1960s: awareness of climate change |
1965: President Lyndon B. Johnson acknowledges the danger of increasing CO₂ emissions [The White House 1965] |
|
1970s: early legislative foundations |
1978: President Carter enacts the National Climate Program Act, focusing on climate control but lacking specific emission reduction measures. Bipartisan consensus on addressing rising air temperatures. |
|
1980s: skepticism and shifts |
1981: President Reagan reduces funding for atmospheric CO₂ research, focusing on overcoming the energy crisis and inflation [Waxman 2019]; no specific emissions reduction efforts but business-driven market solutions were supported. |
|
1990s: global agreements and domestic challenges |
1993: President Clinton proposes a BTU tax to reduce emissions [Royden 2002. P. 415–416]. 1997: The US signs the Kyoto Protocol but does not ratify it due to the Byrd-Hagel Resolution, opposing commitments that excluded developing nations [Biniaz 2018. P. 2–3]. Clinton initiates voluntary climate programs and the $6.3 billion Climate Change Technology Initiative (CCTI) to promote energy-efficient technologies. However, the US fails to meet its voluntary UNFCCC targets [Royden 2002. P. 416–417]. |
|
2000s: retreat and minimal action |
2001: President George W. Bush rejects the Kyoto Protocol, arguing it would hurt the US economy [Borger 2001]. Bush’s administration aimed to lower the GHG intensity of the economy by 18% from 2002 to 2012, a target criticized for being in line with historical trends [Dawson 2003]. Bush’s plan included supporting oil exploration in federally protected areas, subsidies for coal and nuclear power, and weakening environmental regulations. |
Source: Author’s analysis.
The election of President Barack Obama marked an important shift in the United States’ approach to climate policy. In 2009, the Obama administration introduced regulations that would, for the first time, set nationwide restrictions on transport GHG emissions. These rules required an approximate 40% growth in fuel economy for cars and light trucks in the US market by 2016 [Broder 2009]. Also under Obama, the country joined the Paris Agreement in 2015. A central component of Obama’s domestic climate policy was the Clean Power Plan, an initiative designed to reduce CO₂ emissions from the power sector by 32% by 2030 compared to 2005 levels [General White House Bibliography 2015].
However, in a cyclical turn of political tides, President Donald Trump supported the ideas of George W. Bush and cancelled the majority of President Obama’s executive orders. One of the most significant rollbacks was the withdrawal from the Paris Agreement, as Trump’s administration argued that the agreement created an excessive burden on the American economy and workers. Another key initiative that faced reversal was the Clean Power Plan, which was replaced with the Affordable Clean Energy rule, providing states with more authority and fewer guidelines for regulating power plant emissions [Aldy 2017. P. 1–2]. The Trump administration also revised the Corporate Average Fuel Economy standards [Shepardson 2020].
President Trump restructured the Environmental Protection Agency (EPA), leading to the dismissal of a significant number of its staff. Consequently, new leaders like Scott Pruitt and former coal lobbyist Andrew R. Wheeler, who were climate change skeptics, transformed the EPA into a tool for the president’s economic policy [Kovalev 2022. P. 30]. For instance, in September 2017, the Agency published a strategic plan for 2018–2022 that omitted any mention of global climate change and revoked California’s authority to set its own emissions standards. In response to the administration’s clear commitment to climate deregulation, hundreds of litigants turned to the judicial system [Silverman-Roati 2021. P. 27].
In the first two years of Trump’s presidency, primary energy consumption in the United States (Figure 1) showed a trend of stability with a slight increase until 2020, when the COVID-19 pandemic caused a significant drop in both total and per capita energy use. Notably, there was an overall upward trajectory in primary energy consumption while CO₂ emissions experienced a significant decline, mirroring the country’s economic development, industrialization, and population increase [Energy Institute 2024]. Moreover, during the last few years, the United States has witnessed a consistent decrease in energy intensity1 due to the integration of innovative energy-efficient technologies, a major shift from coal to natural gas in electricity generation after the shale revolution, and the optimization of energy consumption across various economic sectors.
Figure 1. Primary Energy Consumption and CO₂ Equivalent Emissions from Energy, Process Emissions, Methane, and Flaring from 1965 to 2023, EJ and trillion tons of carbon dioxide equivalent

Primary Energy Consumption – left; CO₂ Equivalent Emissions from Energy, Process Emissions, Methane, and Flaring – right.
Source: Author’s calculations based on the Energy Institute Statistical Review of World Energy, 2024. Available at: https://www.energyinst.org/statistical-review
The Democratic Party criticized the decision to withdraw from the Paris Agreement, calling it a political decision with grave ramifications for the safety of the planet. In the international arena, the response was similarly disapproving. For this reason, one of Biden’s first actions after taking office was to return the US to the Paris Climate Agreement in 2021. In April of the same year, the US published a nationally determined contribution (NDC) [UNFCCC 2021], establishing a goal of limiting the global average temperature increase to below 2°C above pre-industrial levels by reducing its net GHG emissions by 50-52% below 2005 levels in 2030.
Firstly, the US NDC reveals ways of minimizing emissions in the electric power industry, as currently fossil fuels are the largest source of electricity generation. In 2010, coal was the dominant source of electricity generation, contributing significantly more than any other source. However, by 2023, coal’s role had diminished drastically, and it is expected to decrease more over time, as the US has formed a strategy to achieve 100% carbon pollution-free electricity by 2035.2 Secondly, SUVs, pickup trucks, followed by heavy trucks, airplanes, railways and ships are the primary emitters in the American transportation sector. This is mostly attributed to the car-centric lifestyle in the US: in 2019, the US was ranked as a top-tier country for vehicles in use, and heavy reliance on petroleum-based fuels accounted for 90% [NationMaster 2019]. Policies that can contribute to emissions reduction include incentives for zero-emission personal vehicles, public charging, and investment in a wider array of transportation infrastructure [UNFCCC 2021].
Emissions in almost all sectors peaked in the early 2000s and experienced subsequent declines or stabilization, indicating a shift towards more sustainable and efficient energy use. The transformation of the US energy sector, as presented in Figure 2, with a decrease in coal-based power generation and consumption and an increase in natural gas and renewable energy sources, has been a key driver of this shift.3 Under the Biden administration, efforts were made to accelerate electric vehicle (EV) adoption and infrastructure development with significant overall investments supporting clean energy and transportation. In February 2023, the White House announced plans for a nationwide EV charging network, aiming for 500,000 chargers and 50% of new car sales to be electric by 2030.4
Figure 2. US primary energy consumption and production by source, 2000–2023, Quadrillion BTUs
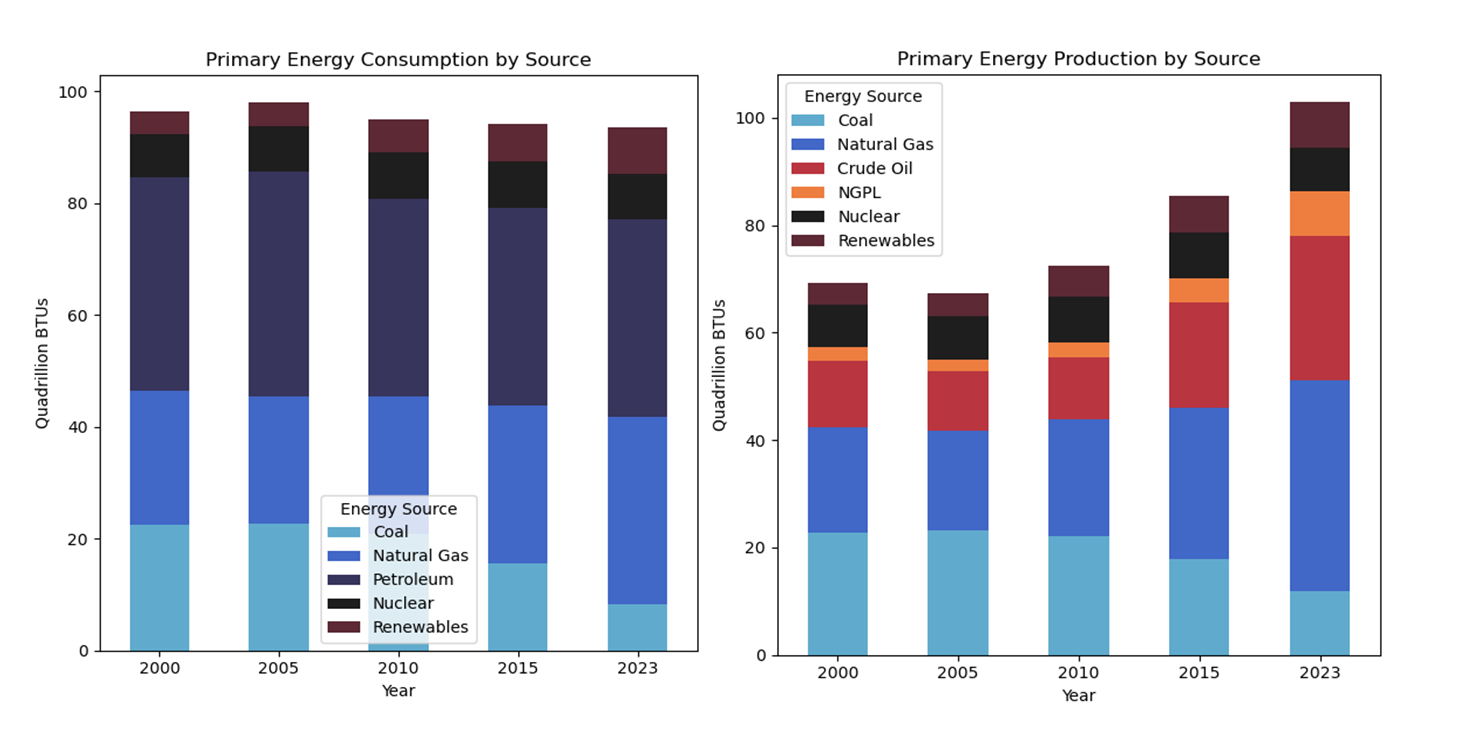
Source: Author’s calculations based on US Energy Information Administration, Monthly Energy Review, Table 1.3, April 2023 and US Energy Information Administration, Monthly Energy Review, Table 1.2, April 2023 https://www.eia.gov/energyexplained/us-energy-facts/
One of Congress’s most significant and ambitious actions on clean energy investment is the Inflation Reduction Act (IRA). This act makes a historic down payment on budget deficit reduction to lower inflation rates, invest in domestic energy production and manufacturing and reduce CO₂ emissions by approximately 40% by 2030 – $369 billion for the FY2022 Budget Reconciliation over the next 10 years [Senate Democrats 2022]. The IRA includes several tax provisions, grants, and loans to support the deployment of innovative clean energy programs. The renewables industry is expected to see over 170 GW of new solar, wind and storage capacity unlocked by the Act [Rystad 2023].
Figure 3 gives a clear illustration of investment trends in sustainable technologies, segmented into two distinct periods: before (2021–2022) and after (2022–2023) the enactment of the IRA. One of the key observations is the substantial increase in investments across all technologies following the act, particularly noticeable in the batteries and EV sectors. In the pre-act period, while investments were notable, they were considerably lower than those made post-act. Offshore wind and solar technologies also received considerable investments, reflecting a broader trend towards RES as companies take steps to benefit from available tax credits.
Figure 3. Reported investments in green technologies under Biden Administration, pre- (2021–2022) and post-Inflation Reduction Act (2022–2023), billion USD
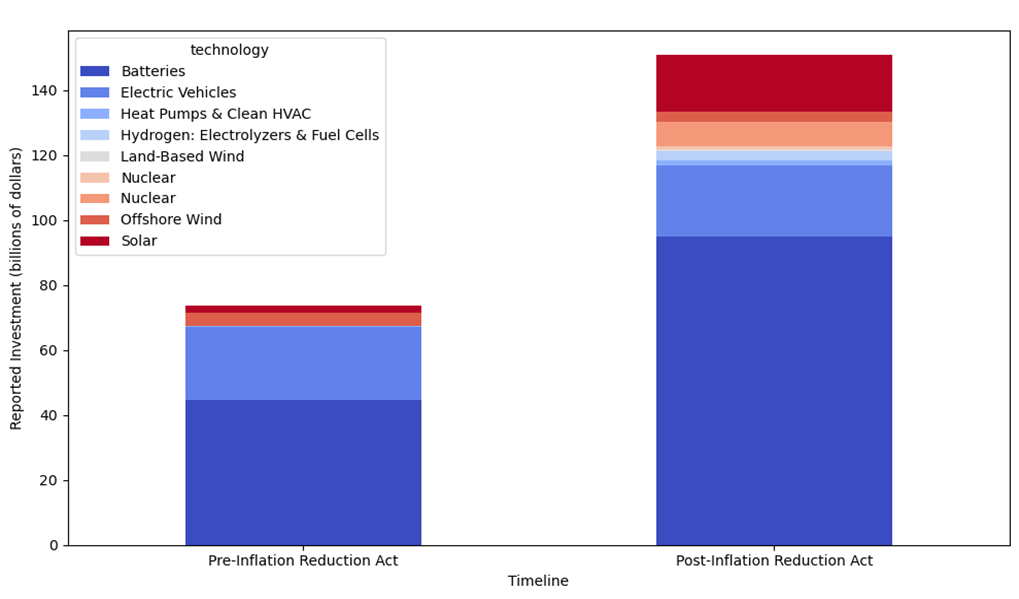
Source: Author’s calculations based on US Department of Energy Investment Announced Under Biden Administration, 2023, https://www.energy.gov/invest
Lastly, the trajectory of the US energy system under the Biden administration is indeed set towards decarbonization. Bipartisan cooperation could be the key to addressing the impacts of climate change and improving energy efficiency. However, significant disagreements remain and there has been little research into whether the parties could really cooperate or not. We therefore believe that discussion of this topic remains open, and that the country still has a lot to do in order to ensure and stabilize its sustainable development.
2. State-level divergence in decarbonization: one goal but different priorities
2.1. The impact of regional features on state-level emission patterns
One of the distinctive features of the American legal framework is its organization on a federal basis. States possess extensive authority in various areas; thus, they play a central role in achieving carbon neutrality in the US due to their significant contribution to policymaking and strategy planning.
Numerous US states have made significant strides toward reducing greenhouse gas emissions and adopting cleaner energy sources. However, others continue to rely heavily on high-emission energy practices, struggling to transition from historical patterns of fossil fuel dependence. Overall, the EIA indicates clear progress in reducing carbon emissions in the US energy sector in the past two decades. The largest emissions (Figure 4) are observed in Texas (683 million metric tons, 13.5% of US emissions), California (358 million metric tons, 6.6% of the US emissions), Florida (234 million metric tons, 4.6% of US emissions), Pennsylvania (214 million metric tons, 4.3% of US emissions), and Ohio (195 million metric tons, 4% of US emissions).
Figure 4. Energy-related carbon dioxide emissions in US states, 2021, million metric tons
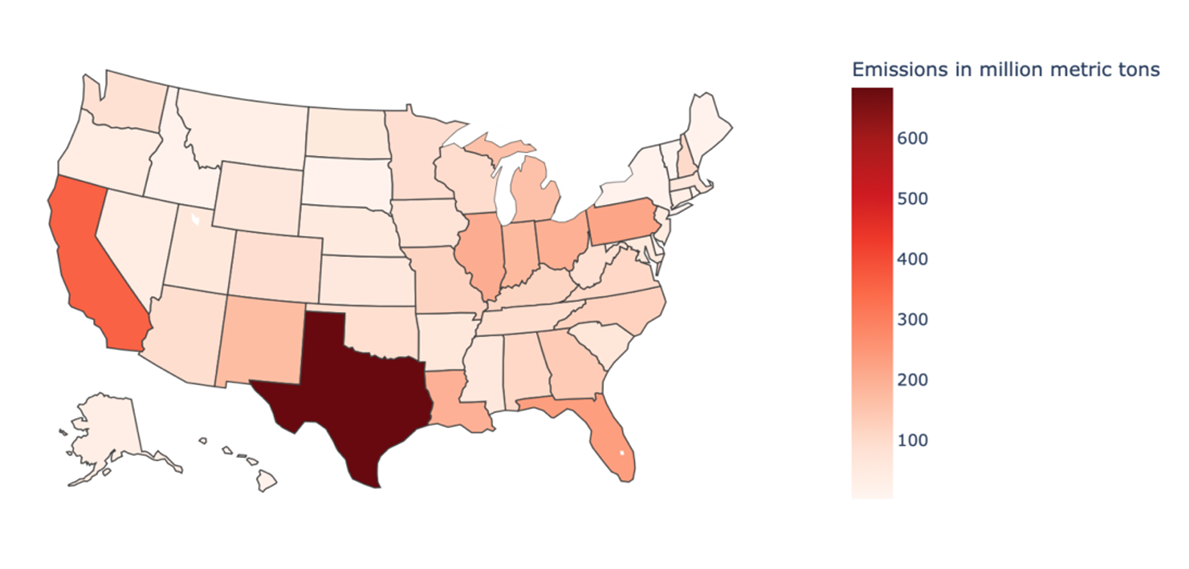
Source: Author’s calculations based on EIA State energy-related carbon dioxide emissions by year, 2023 https://www.eia.gov/environment/emissions/state/
Texas has demonstrated an increase in CO₂ emissions due to its significant power generation and industrial activities. Texas is a major hub, hosting 30% of US refining capacity and 70% of its petrochemical production, which contribute to about 58% of total industrial energy consumption. Nevertheless, electricity generation has experienced a notable shift away from coal, which accounted for 60% of CO₂ emissions in 2016, due to the rise of natural gas – a key outcome of the US shale revolution. This transition has been influenced by increased natural gas availability and the economic advantages it offers. Texas has also implemented favorable tax policies that encourage the development of renewables, and has significantly capitalized on its vast land and favorable weather conditions, expanding its solar energy capabilities and becoming a leader in wind energy production in the US. These incentives have stimulated investments in wind and solar power projects, contributing to the reduction in electricity production costs [Rudolph et al. 2023. P. 17–18].
California launched North America’s first large-scale cap-and-trade program, achieving a 5.3% emissions reduction from 2013 to 2017, though separating the effects of this program from other state efforts is complex. The industry and transportation sectors, however, continue to favor fossil fuels due to the high costs of alternatives like green hydrogen and EVs. The state has approximately 30 million registered vehicles, more than any other state in the US, followed by Florida with 18 million registered cars.5
Despite having broad climate goals, California saw emissions from large-scale facilities increase in 2021. To address this, new laws require companies with over $1 billion in revenue to disclose direct and indirect (“Scope 3”) emissions, and those with over $500 million to report climate-related financial risks by 2026 [Noor 2023]. This state-level push could inform future federal regulations, as the SEC considers similar mandates for publicly traded companies.
The key states in terms of per capita emissions are Wyoming, North Carolina, Alaska, West Virginia, and Louisiana. Wyoming, with the smallest population among the states and a low density only surpassed by Alaska, stands as the second-largest net energy supplier in the US, following Texas, due to its significant energy production, exceeding consumption twelvefold. It leads in coal production and holds numerous oil and gas leases on federal lands [EIA (7)]. West Virginia ranks as the second-largest coal producer, contributing substantially to the national output and reserves [EIA (6)]. Louisiana, third in natural gas production, possesses significant refining capacity, contributing significantly to the nation’s liquefied natural gas and coal exports [EIA (3)].
The factors that impact CO₂ emissions at the state level in the US are primarily shaped by regional features. For instance, while the US lacks a federal carbon price, various states effectively implement carbon pricing strategies that include cap-and-trade systems and regulatory measures.6
Similar to energy intensity, regions with higher carbon intensity in their energy mix also tend to have higher per capita emissions [EIA (1). P. 5]. Notably, the states with the highest carbon intensity in their energy supply are West Virginia, Wyoming, Kentucky, Missouri, and Utah.7 In these states, coal is the main source of emissions. In contrast, states with lower carbon intensity often have a significant contribution from non-carbon sources such as nuclear or hydroelectric power, including Vermont, South Dakota, Washington, and Oregon.8
Moreover, national investments in renewables and sustainable practices profoundly affect carbon emission reduction. X. Ren with co-authors [Ren et al. 2020] demonstrated that increasing investments in green credit, green securities, green insurance, and green investment, along with expanding RES, significantly reduce carbon emissions. Similarly, Raghutla et al. (2021) identified capital investment factors as critical in promoting the adoption of renewables, underscoring their pivotal role in mitigating carbon emissions [Raghutla et al. 2021].
As mentioned in the previous section, democrats tend to emphasize climate change mitigation, while Republicans focus on economic benefits, energy independence, and lower energy costs. However, whether these federal policy shifts are translated similarly at the state level remains a topic of considerable debate. To begin with, the installation of renewable energy capacity tends to increase more under Democratic governors compared to their Republican counterparts. However, the impact of party affiliation on renewable power generation and CO₂ emissions is not uniform across states and is significantly affected by the specific context in which governors operate.
The study by Paolo Bonnet and Alessandro Olper (2024) suggests that in states where the manufacturing industry is significant, Democratic governors do not differ from Republicans in renewable energy achievements, while Democratic state leaders are more successful in promoting renewables in states rich in those energy resources [Bonnet et al. 2024]. This indicates that robust economic incentives linked to energy-intensive industries can hinder the progress of renewable energy adoption, influencing the decisions of politicians who typically support green initiatives.
A notable example is the prominence of Republican-leaning states in wind power production. As of 2022, the top five states generating the largest share of wind power are all Republican: Iowa, South Dakota, Kansas, Oklahoma, and North Dakota. Yet blue states exhibit a stronger preference for solar power and lead in the adoption of solar photovoltaic technology, significantly contributing to national solar power output [Ritchie 2024].
While the adoption of renewables in red states is primarily driven by economic incentives rather than environmental concerns, this represents a significant shift. The financial benefits of renewable energy, especially wind energy in the “wind belt” states, provide substantial returns for landowners and stable income streams for communities. Red states have also shown flexibility in their regulatory frameworks and benefited greatly from federal incentives through recent legislative initiatives [Ritchie 2024].
Economic growth has been traditionally associated with increased energy consumption, which in turn leads to higher CO₂ emissions, particularly in states with energy-intensive industries. However, recent trends suggest that this relationship may be evolving, raising a question whether or not economic prosperity can be achieved with lower carbon outputs.
The economic contributions of the top five US states – California, Texas, New York, Florida, and Illinois – are significant, together accounting for approximately 41.5% of the nation’s GDP. Each state’s GDP is driven by its unique industry structure, reflecting the diverse economic landscape of the United States. The California’s economic strength is primarily derived from its real estate sector, alongside the professional, scientific, and technical services industries, which are central to Silicon Valley’s global tech dominance. Texas, the second-largest contributor, owes much of its economic output to the energy sector. The state’s vast oil and gas reserves have historically been the backbone of its economy, but manufacturing and real estate also play substantial roles, reflecting a more diversified economic base than in previous decades. The New York economy is heavily influenced by the finance and insurance industries, while Florida benefits significantly from tourism and real estate.
In fact, New York, the state with the largest per capita GDP, has introduced an initiative to decarbonize, which is anchored in the 2019 Climate Act. This law outlines a comprehensive strategy for mitigating climate change, transitioning to a clean energy economy and addressing environmental justice issues. The primary objective is to reduce GHG emissions across all sectors of the state’s economy, achieving a 40% reduction by 2030 and an 85% reduction by 2050, based on 1990 levels, with a target of net-zero emissions by mid-century [New York State Climate Action Council 2022].
New York’s proposed “cap-and-invest” program, a key component of its broader climate initiative, aims to place a statewide limit on greenhouse gas emissions, aligning with the reduction targets established by the Climate Act. Similar to cap-and-trade systems in other regions, such as California, the program will require fuel wholesalers and other high-emission entities to purchase a gradually decreasing number of allowances to emit carbon. The revenues generated through the sale of these emissions allowances, expected to total billions of dollars, will be directed towards funding clean energy incentives, grants, and other investments in green infrastructure [French 2022].
Figure 5 reveals distinct trends in economic disparities between different regions based on their population. Overall, western and northern states generally tend to enjoy higher economic prosperity compared to their southern and some eastern counterparts except states like New York and Massachusetts. California and New York, despite being the most populous states with over 39 million and 19 million residents respectively, showcased a high GDP per capita of $80,372 and $86,855. In contrast, Wyoming, with a population of only 580,000, had a GDP per capita of $63,721, primarily due to its energy production sector.9
States such as California, Texas, and Washington experienced some of the highest real GDP per capita growth from 2010 to 2021, with GDP per capita increases of 39%, 36% and 21% respectively. However, states with diversified economies like Colorado and Utah also performed well, with GDP per capita growth of 27% and 30% respectively. Conversely, certain states, particularly those heavily reliant on specific industries, experienced stagnation or even contraction in economic growth. Alaska and Wyoming witnessed a decline in GDP per capita by 8%, while Louisiana saw an even steeper drop of 9%, largely due to the inherent volatility of the oil and gas sectors.
At the same time, the majority of states showed notable reductions of per capita CO₂ emissions, while only a few experienced slight increases. Even states with historically high emissions, such as Wyoming and North Dakota, managed to lower their CO₂ output by 19% and 7% respectively. However, despite these reductions, they continue to rank among the highest emitters in the nation, highlighting both the progress and the persistent challenges faced by regions with entrenched carbon-intensive industries.
In contrast, states like Alaska and Idaho saw increases in per capita emissions, with Alaska rising by 1.7% and Idaho by 4.1%. Alaska’s increase is linked to its reliance on energy-intensive industries, such as oil extraction, while Idaho’s per capita emissions is unlikely to significantly impact the broader national emissions goals due to the minimum share of 0.4% of total emissions.
It is evident that states with larger economies, such as California, Texas, and New York, consistently exhibit the highest overall CO₂ emissions (Figure 5). The correlation between economic output and carbon emissions, approximately 0.75, suggests that states with greater economic productivity tend to generate higher levels of CO₂.
On a per capita basis, the nexus between economic prosperity and environmental impact becomes more complex as states with higher GDP per capita are not necessarily the ones with the highest CO₂ emissions per capita (correlation is -0.08). Economic growth does not always lead to higher emissions per person, as some states have managed to decouple economic prosperity from environmental impact, which could be due to cleaner energy sources, more efficient energy use, or stronger environmental regulations. On the other hand, some states with lower GDP per capita exhibit much higher CO₂ emissions per person, likely reflecting greater reliance on fossil fuels and less developed sustainable infrastructure.
In the graphs presented here, there are several notable aspects of Texas due to the imbalance between its high total economic output and its environmental impact. While Texas is the second state in terms of total GDP, its carbon emissions, both in total and on a per capita basis, are disproportionately high compared to other states with a similar economic output. This discrepancy points to the central role of energy and industrial production in the Texan economy and highlights the state’s ongoing challenges in managing its environmental footprint. The future trajectory of Texas’s economy and its approach to sustainability will likely depend on the state’s ability to transition to cleaner energy sources while maintaining its economic growth.
Figure 5. Left to right real GDP increase and total CO₂ and left to right GDP per capita increase and CO₂ emissions per capita across US states, 2021.
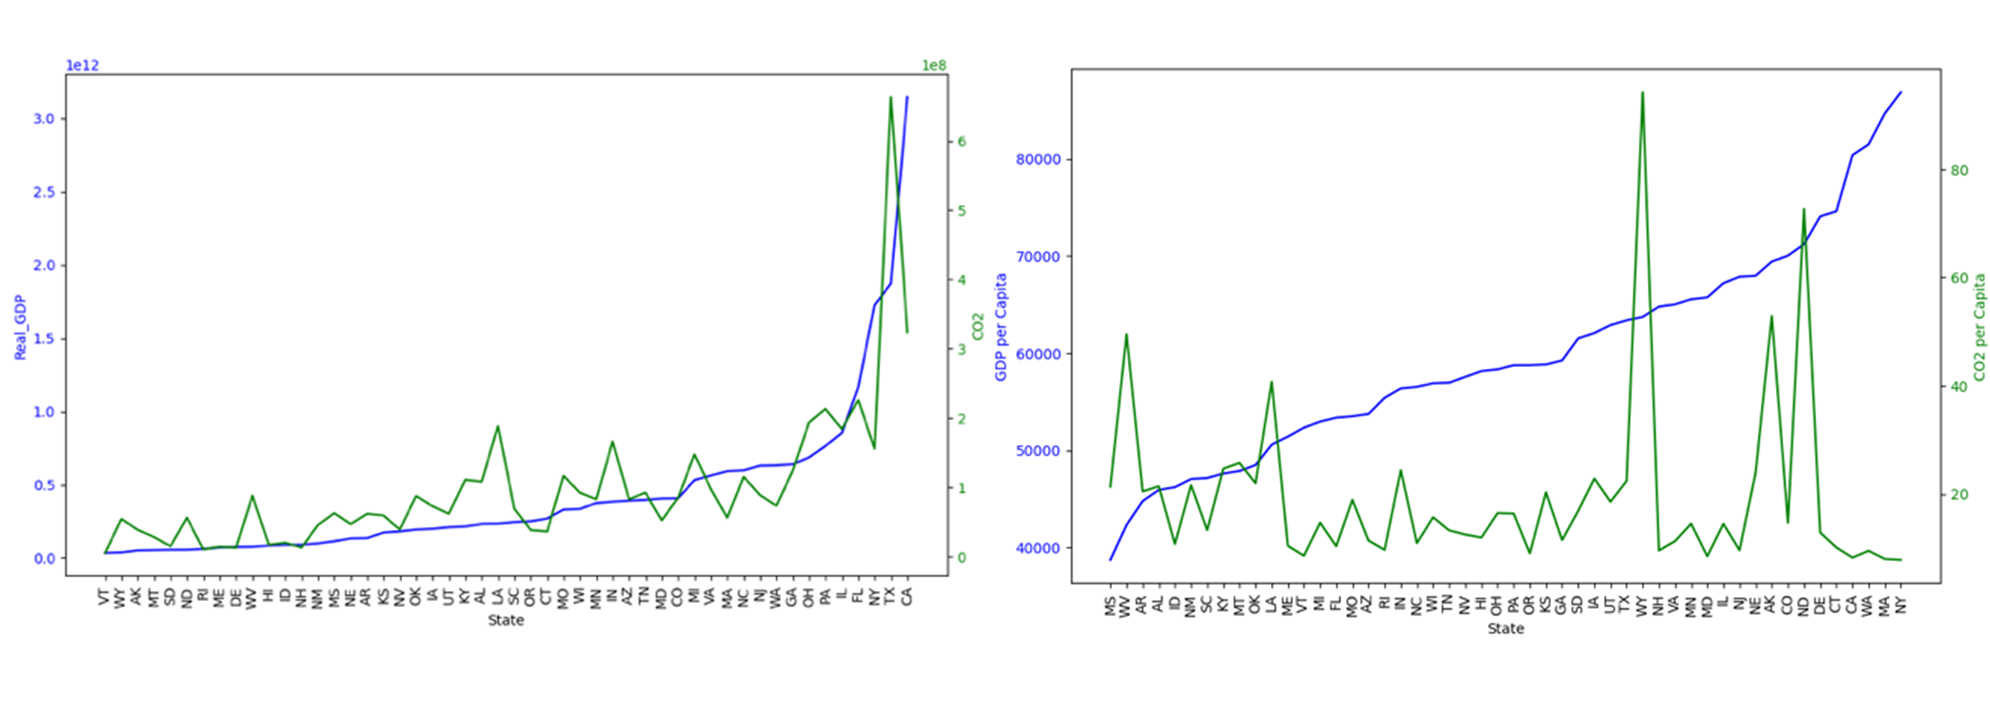
Source: Author’s calculations based on EIA Population, GDP, and degree days, State Energy Data System (SEDS): 1960-2022 (complete), 2024 https://www.eia.gov/state/seds/seds-data-complete.php?sid=US; EIA State energy-related carbon dioxide emissions by year, 2024 https://www.eia.gov/environment/emissions/state/
Sustainable prosperity requires economic growth that protects natural resources and ensures the well-being of future generations. Across the US, the pursuit of this balance has taken on increasing importance, as states strive to meet both national goals and international commitments, such as the United Nations’ Sustainable Development Goals (SDGs), established in 2015.
The SDGs are 17 global objectives aimed at tackling poverty, inequality, climate change, and injustice, while promoting peace, prosperity, and sustainable growth [UN DESA]. Many US states are not on track to meet the SDGs by 2030, especially in areas like environmental protection, inequality, and public health. Key indicators – energy-related CO₂ emissions (Goal 13) and CO₂ intensity of electricity (Goal 7) – show slow progress toward the 1.7 tons per capita CO₂ target by 2050. Despite some advances, average state improvement is only 1.25 points per year, with minimal or no change in some cases, and Alaska has seen a decline in its SDG score since 2015 [Lynch et al. 2021. P. 7–8, 14, 17].
The correlation between a state’s GDP per capita and its SDG index score also reveals a critical trend: states with higher GDP per capita often demonstrate stronger performance on the SDG index. This relationship suggests that wealthier states possess the resources and infrastructure necessary to advance sustainable development more effectively. However, economic growth alone is not enough to ensure sustainability; deliberate policies are required to balance prosperity with environmental stewardship and social equity.
Twenty-three states, along with the District of Columbia and Puerto Rico, have set targets to achieve 100% clean energy or carbon-free electricity by 2050. Together, these regions account for approximately 41% of the nation’s total CO₂ emissions. However, the varying timelines and energy mixes proposed by each state, coupled with the existing reliance on fossil fuels, suggest that achieving these goals within the proposed timeframes, as presented in Table 2, is unlikely.
The table shows a general trend where states with higher SDG scores, indicating a stronger commitment to sustainable development, tend to have lower per capita CO₂ emissions. States from Massachusetts to Colorado, all with SDG scores above 53, have some of the lowest emissions, averaging at 10.3 metric tons per capita. In contrast, states with lower SDG scores, from New Jersey to Louisiana, exhibit notably higher emissions with an average of 16.5 metric tons. For example, Louisiana, with an SDG score of 31.2, has the highest per capita CO₂ emissions at 40.8 tons, reflecting its heavy reliance on fossil fuel industries. The largest discrepancy between SDG score and per capita emissions is observed in Nebraska, which has a moderately ambitious emissions target but one of the highest per capita emissions due to its agricultural sector and fossil fuel combustion. Similarly, Colorado and Minnesota show a significant gap between their mid-level SDG scores and higher emissions because of the transportation and electric power sector.
Projections by EIA suggest that to meet even 45% of energy demand, renewable energy production would need to triple, underscoring the scale of transformation needed. Challenges include inconsistent policies, governance issues, and a lack of stakeholder engagement, making decarbonization goals difficult to achieve within set timelines [Cefaratti-Bertin 2024]. Furthermore, research by Garrett and McManaway indicates that, even under the best-case scenario, cities will cover only 35-65% of energy needs from renewables over the next 20-30 years, highlighting the need for substantial investment in grid management and energy storage infrastructure [Cefaratti-Bertin 2024].
Table 2. Clean Energy Goals of the states, SDG score and per capita CO₂ emissions, 2021
|
State |
The Goal |
SDG score |
Per capita CO₂ emissions |
|
Massachusetts |
Net-zero GHG emissions by 2050 |
58.8 |
8.0 |
|
Washington |
100% zero-emissions electricity by 2045 |
58.2 |
9.5 |
|
Minnesota |
100% carbon-free electricity by 2040 |
57.1 |
14.6 |
|
Maine |
100% clean energy by 2050 |
56.2 |
10.5 |
|
Oregon |
GHG emissions reduced 100% below baseline emissions by 2040 |
55.5 |
9.1 |
|
Hawaii |
100% renewable energy by 2045 through the RPS |
54.5 |
12.0 |
|
Maryland |
Net-zero GHG emissions by 2045 |
54.3 |
8.5 |
|
California |
100% carbon-free electricity by 2045 |
54.1 |
8.3 |
|
New York |
100% carbon-free electricity by 2040 |
53.9 |
7.9 |
|
Connecticut |
100% carbon-free electricity by 2040 |
53.8 |
10.1 |
|
Colorado |
100% carbon-free electricity by 2050 for Xcel Energy |
53.6 |
14.7 |
|
New Jersey |
100% carbon-free electricity by 2035 |
52.4 |
9.6 |
|
Rhode Island |
100% renewable energy electricity by 2033 |
52.3 |
9.7 |
|
Wisconsin |
100% carbon-free electricity by 2050 |
51.2 |
15.7 |
|
Delaware |
100% reduction in GHG emissions |
48.4 |
12.9 |
|
Michigan |
100% carbon-free electricity by 2040 |
48.3 |
14.7 |
|
Virginia |
100% carbon-free electricity by 2045 for Dominion Energy and 2050 for Appalachian Power Company |
48.2 |
11.3 |
|
Nebraska |
Net-zero carbon emissions from generation resources by 2040-2050 |
47.4 |
24.0 |
|
Illinois |
100% clean energy by 2050 |
46.2 |
14.5 |
|
Nevada |
100% carbon-free electricity by 2050 |
44.7 |
12.5 |
|
North Carolina |
Carbon neutrality in the electricity sector by 2050 |
40.4 |
10.9 |
|
New Mexico |
100% carbon-free electricity by 2045 |
37.7 |
21.7 |
|
Louisiana |
Net zero GHG emissions by 2050 |
31.2 |
40.8 |
Source: Author’s calculations based on the Clean Energy States Alliance Table of 100% Clean Energy States https://www.cesa.org/projects/100-clean-energy-collaborative/guide/table-of-100-clean-energy-states/; Lynch, A., Sachs, J., 2021. The United States Sustainable Development Report 2021. New York: SDSN, p. 9 https://s3.amazonaws.com/sustainabledevelopment.report/2021/United+States+Sustainable+Development+Report+2021.pdf; EIA, Energy-Related CO2 Emission Data Tables, Summary tables, Table 4. Per capita energy-related carbon dioxide emissions by state, 2024 https://www.eia.gov/environment/emissions/state/
Overall, the diversity in economic structures and energy profiles among US states underscores the need for tailored approaches to decarbonization, especially in energy-intensive states like Texas and Louisiana. States with more diversified economies, such as California and New York, have shown that economic prosperity and environmental sustainability are not mutually exclusive, leveraging advanced technology and cleaner energy systems to achieve growth while mitigating emissions. As the US aims for ambitious national decarbonization goals, the paths taken by individual states will play a crucial role in determining the success of balancing economic development with the reduction of CO₂ emissions.
2.2. Sustainability prospects through the lens of party affiliation at the state level
As discussed earlier, the implementation of federal climate policies in the United States is not always influenced by the party in power. However, the direct link between a state’s political ideology and emission levels as well as economic growth remains uncertain. We conducted a quantitative analysis using the ANOVA method to explore the relationship between political party affiliation (Democratic, Divided, Republican) [National Conference of State Legislatures 2023] and CO₂ growth from 2010 to 2021,10 GDP growth from 2010 to 2021[EIA (5)], per capita CO₂ emissions11 and SDG score [Lynch et al. 2021].
To begin with, the data was normalized to ensure consistency across the different variables. Each political party was then assigned a numerical code for analysis purposes: the Democratic party was coded as 1, states with divided governance as 2, and the Republican party as 3. More detailed ANOVA results are presented in Appendix 1.
The main objective of the analysis was to test several hypotheses. The first hypothesis examined whether there were any statistically significant differences in CO₂ growth between the political parties. The findings showed no significant differences (p-value 0.8), indicating that party affiliation did not appear to influence CO₂ growth. This result implies that a state’s industrial composition, reliance on certain energy sources, and historical emissions levels may have a stronger role than party control in determining emissions growth. The second hypothesis considered GDP growth among different parties; similarly, no significant differences were found. This suggests that political party affiliation operates independently and has no substantial effect on GDP growth rates.
In contrast, the analysis of the SDG index reveals more profound results. The hypothesis that the average SDG index is the same across all political parties is rejected, with the ANOVA showing significant differences between the parties (p-value of 0.0005), which was confirmed by Turkey’s test (Appendix 2). Specifically, the Democratic and Divided states showed no significant differences in their SDG indices, suggesting that their performance on sustainable development goals is similar. However, as presented in Figure 6, the analysis revealed significant differences between Democratic and Republican states, as well as between Divided and Republican states, with republican-controlled states having lower SDG index values and indicating a poorer performance in terms of sustainable development.
Figure 6. SDG index distribution by political parties (Democratic, Divided, Republican)
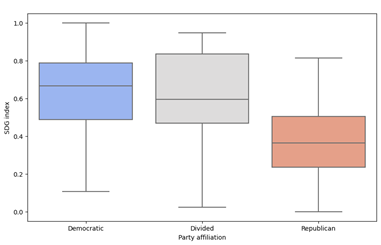
Source: Author’s calculations.
The findings from our analysis align with the previous discussion, reinforcing the conclusion that political party affiliation has a minimal impact on climate mitigation. Divided states, where political power is shared between Democratic and Republican parties, tend to have SDG index scores similar to the states controlled by Democrats. This means that broader structural and economic factors, rather than party affiliation alone, influence a state’s progress towards sustainable development. Understanding this can foster collaborative efforts to achieve climate targets, focusing on common goals rather than divisive partisan divides. Research by R. Gurney with co-authors [Gurney et al. 2021] also suggests that state political affiliation had no significant impact on local climate adaptation efforts in any instance, underscoring the importance of the distinct political dynamics within individual cities and their economic conditions.
In conclusion, emissions and decarbonization policies are a reflection of the cumulative and complex nature of the US states’ economies. While federal efforts provide a framework, it is the states themselves that play a crucial role in shaping their environmental destinies through factors such as geography, politics, and economic interests. States that have already embarked on the path of decarbonization serve as precedents for others, demonstrating how regional economies can take the lead in addressing global environmental challenges, even when federal policies may be slower to evolve. Their progress not only provides a model for other states, but also highlights the potential for decentralized climate action to have a wider national, and even global, impact.
Discussion and conclusion
While national policy and global trends set the overall direction, the specifics of the energy shift are greatly influenced by local geographic, economic, cultural, and technological conditions. In each region, these conditions combine in specific ways to create distinct paths toward a more sustainable energy future: from the resource-rich heartlands of Texas to the technological hubs of California – the United States encompasses a remarkable diversity of energy assets and cultural dynamics that influence the trajectory of decarbonization. The diversity in state-level responses to climate change reflects the complexities of balancing economic growth, energy independence, and environmental sustainability.
The results of modeling found no statistically significant differences in CO₂ growth or GDP growth based on party affiliation, confirming that state-level greenhouse gas emissions patterns are largely shaped by the cumulative effects of long-term economic and energy trends rather than by political party affiliation or short-term policy changes. The overall analysis shows that structural economic factors, local industry composition, and regional energy resources play a more significant role in determining emissions outcomes than the political landscape. This suggests that while political decisions can influence the pace of policy implementation, they do not fundamentally alter the underlying trajectory of state-level decarbonization efforts.
Therefore, it is the states themselves, with their distinct regional characteristics, that shape the progress of energy transformation and determine whether it will take place in the country at all. Geography mostly dictates the availability and potential of different RES, guiding the states in terms of which sources they can rely on. The socioeconomic characteristics of each region also have a profound impact. In regions historically reliant on fossil fuel industries, there is often resistance to change due to economic dependency and cultural identity. This resistance can slow or even obstruct the adoption of RES, highlighting how economic interests and historical legacies can impede transformation. In contrast, regions with strong tech industries and innovation hubs, such as California, benefit from a culture of innovation that drives investment in renewable technologies, energy storage, and EVs. On the contrary, the agricultural midwest, with its vast corn and soybean fields, has embraced biofuels in addition to wind energy.
In the near term, there is a significant opportunity to accelerate the adoption of energy efficiency technologies, provided that institutional challenges are addressed. These energy efficiency measures are already cost-effective, relatively easy to implement, and do not require significant technical advancements. Focusing on the electric power and transportation sectors is particularly promising, as it offers more potential to save considerably more energy and reduce GHG emissions than implementing end-use technologies in buildings and vehicles.
Our research also suggests that the instability of federal climate policy, caused by changes in the governing party, complicates the development of consistent national strategies. For example, under the Trump administration, many climate policies implemented during the Obama administration were reversed, and support for the fossil fuel industry was increased. This lack of consistency makes it difficult to establish a stable national approach to addressing climate change.
However, another important aspect that remains to be explored is the interaction between states. Although investments in decarbonization are growing, driven by legislation such as the Inflation Reduction Act, the balance between state competition for economic growth and the need for regional cooperation has not been fully investigated. Future research could examine whether states see decarbonization as a zero-sum game, or if they recognize the potential for greater achievement through collaboration.
Bibliography
Aldy, J. E., 2017. Real world headwinds for Trump climate change policy. Bulletin of the Atomic Scientists. 2017. pp.1–6.
Biniaz, S., 2018. What Happened to Byrd–Hagel? It’s Curious Absence from Evaluations of the Paris Agreement. Sabin Center for Climate Change Law, Columbia Law School. pp.1–17.
Bonnet, P. et al., 2024. Party affiliation, economic interests and U.S. governors’ renewable energy policies. Energy Economics. Vol. 130(C). pp.1–22.
Borger, J., 2001. Bush kills global warming treaty. The Guardian. 2001. March 29. Available at: https:www.theguardian.com/environment/2001/mar/29/globalwarming.usnews
Broder, J. M., 2009. New Standard Links Mileage and Gas Emissions. The New York Times. September 16. Available at: https:www.nytimes.com/2009/09/16/business/energy-environment/16cars.html
Cefaratti-Bertin, S., 2024. Renewable Energy Goals Are Unattainable by 2050. Baylor University Media & Public Relations. Available at: https:news.web.baylor.edu/news/story/2024/renewable-energy-goals-are-unattainable-2050
Clean Energy States Alliance. Table of 100% Clean Energy States. Available at: https:www.cesa.org/projects/100-clean-energy-collaborative/guide/table-of-100-clean-energy-states/
Dawson, B., 2003. The politics of energy: Coal and Bush’s greenhouse-gas policy. The Center for Public Integrity. Available at: https:publicintegrity.org/environment/the-politics-of-energy-coal-and-bushs-greenhouse-gas-policy/
EIA (1). Energy-Related Carbon Dioxide Emissions by State, 2005–2016. pp.1–29. Available at: https:www.eia.gov/environment/emissions/state/analysis/pdf/stateanalysis.pdf
EIA (2). Energy-Related CO2 Emission Data Tables. Available at: https:www.eia.gov/environment/emissions/state/
EIA (3). Louisiana Profile Overview. Available at: https:www.eia.gov/state/?sid=LA
EIA (4). Monthly Energy Review. Available at: https:www.eia.gov/energyexplained/us-energy-facts/
EIA (5). State Energy Data System (SEDS): 1960-2022 (complete). Available at: https:www.eia.gov/state/seds/seds-data-complete.php?sid=US
EIA (6). West Virginia State Energy Profile. Available at: https:www.eia.gov/state/print.php?sid=WV
EIA (7). Wyoming Profile Analysis. Available at: https:www.eia.gov/state/analysis.php?sid=WY
Energy Institute, 2024. Statistical Review of World Energy. Available at: https:www.energyinst.org/statistical-review
French, M. J., 2022. New York passes sweeping plan to reduce emissions and ‘lead the way on solving climate change’. Politico. December 19. Available at: https:www.politico.com/news/2022/12/19/new-york-emissions-climate-change-00074600
General White House Bibliography: The White House President Barack Obama Climate Change and President Obama’s Action Plan. 2015. Available at: https:obamawhitehouse.archives.gov/president–obama–climate–action–plan
Gurney, R.M. et al., 2021. The influences of power, politics, and climate risk on US subnational climate action. Environmental Science & Policy. Vol. 116. pp.96–113.
Kovalev, Yu. Yu., 2022. Climate Policy of the United States: Features of Evolution and the Current State. History and Modern Perspectives. Vol. 4. No 1. pp.24-32 (in Russian).
Lynch, A. et al., 2021. The United States Sustainable Development Report 2021. New York: SDSN. pp.1–64.
National Conference of State Legislatures. State & Legislative Partisan Composition. 2023. Available at: https:www.ncsl.org/about-state-legislatures/state-partisan-composition
NationMaster, 2019. United States Vehicles in Use. Available at: https:www.nationmaster.com/nmx/timeseries/united-states-vehicles-in-use
New York State Climate Action Council. Scoping Plan, December 2022: Executive Summary. Available at: https:climate.ny.gov/-/media/Project/Climate/Files/Chapter1ExecutiveSummary.pdf
Noor, D., 2023. California to require big firms to reveal carbon emissions in first law of its kind. The Guardian. October 9. Available at: https:www.theguardian.com/us-news/2023/oct/09/california-carbon-emissions-law
Raghutla, C. et al., 2021. Financing clean energy projects: new empirical evidence from major investment countries. Renewable Energy. Vol. 169. pp.231–241.
Ren X. et al., 2020. Nexus between green finance, non-fossil energy use, and carbon intensity: empirical evidence from China based on a vector error correction model. Journal of Cleaner Production. Vol. 277. 122844. pp.1–12.
Ritchie, H., 2024. Republican states are going strong on solar and wind, but not for the climate. Sustainability by Numbers. Available at: https:www.sustainabilitybynumbers.com/p/red-states-renewables
Royden, A., 2002. U.S. Climate Change Policy Under President Clinton: A Look Back. Golden Gate University Law Review. Vol. 32. No. 4. Article 3. pp.415–478.
Rudolph, M. et al., 2023. The Impact of Renewable Energy Tax Incentives on Electricity Pricing in Texas. Applied Sciences. 13(14):8532. pp.17–19.
Rystad Energy, 2023. Renewables and Power Post-Inflation Reduction Act: One year later. Whitepaper In-depth analysis on overcoming challenges post-Inflation Reduction Act. pp.1–15.
Senate Democrats. The Inflation Reduction Act of 2022: Summary. p.1.
Shepardson, D., 2020. Trump finalizes rollback of Obama-era vehicle fuel efficiency standards. Reuters. Available at: https:www.reuters.com/article/us-usa-autos-emissions-idUSKBN21I25S#:~:text=Under%20the%20Obama%2Dera%20rules,mpg%20under%20the%20Obama%20rules
Silverman-Roati, K., 2021. U.S. Climate Litigation in the Age of Trump: Full Term. The Sabin Center for Climate Change Law. pp.1–142.
Statista (1). Automobile registrations in the United States in 2021, by state [Graph]. Available at: https:www.statista.com/statistics/196010/total-number-of-registered-automobiles-in-the-us-by-state/
Statista (2). Net electricity generation in the United States from 1990 to 2023, by energy source (in terawatt-hours). Available at: https:www.statista.com/statistics/220174/total-us-electricity-net-generation-by-fuel/
The White House, 1965. Restoring the Quality of Our Environment. Report of the Environment Pollution Panel President’s Science Advisory Committee.
UN DESA. Sustainable Development: The 17 Goals. Available at: https:sdgs.un.org/goals
UNFCCC, 2021. The United States of America Nationally Determined Contribution, Reducing Greenhouse Gases in the United States: A 2030 Emissions Target. pp.1–23.
Waxman, O. B., 2019. Reagan Administration Officials at First Dismissed the Ozone Hole. Here’s What Changed. TIME. Available at: https:time.com/5564651/reagan-ozone-hole/
Appendix
Appendix 1. ANOVA results
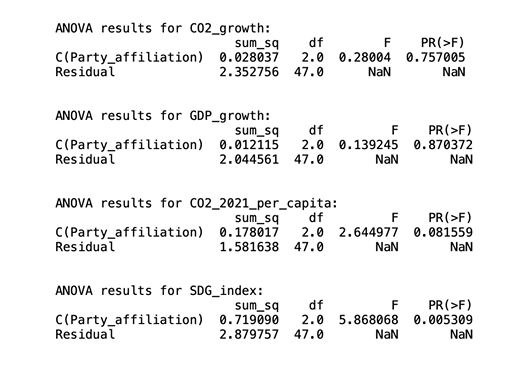
Source: Author’s calculations.
Appendix 2. Turkey’s test
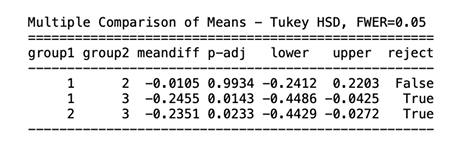
Source: Author’s calculations.
Notes
1 Author’s calculations based on the Energy Institute’s Statistical Review of World Energy, 2024. Available at: https://www.energyinst.org/statistical-review
2 Author’s calculations based on EIA Net electricity generation in the United States from 1990 to 2023, by energy source (in terawatt-hours). In Statista, 2024: https://www.statista.com/statistics/220174/total-us-electricity-net-generation-by-fuel/
3 EIA, Carbon intensity of US power generation continues to fall but varies widely by state, 2022. Available at: https://www.eia.gov/todayinenergy/detail.php?id=53819
4 The White House, Fact Sheet: Biden-Harris Administration Announces New Standards and Major Progress for a Made-in-America National Network of Electric Vehicle Chargers, 2023. Available at: https://www.whitehouse.gov/briefing–room/statements–releases/2023/02/15/fact–sheet–biden–harris–administration–announces–new–standards–and–major–progress–for–a–made–in–america–national–network–of–electric–vehicle–chargers/
5 Daly, L., 2024. How Many Cars Are in the US? Car Ownership Statistics 2024. Motley Fool Money. Available at: https://www.fool.com/the-ascent/research/car-ownership-statistics/
6 Aldy, J.E., Burtraw, D., Fischer, C., Fowlie, M., Williams, R.C., Cropper, M.L., 2022. How is the US Pricing Carbon? How Could We Price Carbon? Journal of Benefit-Cost Analysis. 13(3): p. 1. Available at: https://scholar.harvard.edu/files/jaldy/files/aldy_et_al_jbca_2022.pdf
7 U. S. Energy information Administration (EIA) Table 7. Carbon intensity of the economy by state, 2023 https://www.eia.gov/environment/emissions/state/
8 Ibid.
9 Jansen, D.W., Sinha, S.G., 2024. Top US States by Real GDP and Per Capita Real GDP. Texas A&M University Private Enterprise Research Center. Available at: https://perc.tamu.edu/blog/2024/02/gdp-vs-per-capita-gdp.html
10 EIA, State energy-related carbon dioxide emissions by year, 2024. Available at: https://www.eia.gov/environment/emissions/state/
11 EIA, State energy-related carbon dioxide emissions by year, 2024. Available at: https://www.eia.gov/environment/emissions/state/

1.jpg)
