
Key Issues in the Long-Term Growth of the US Economy
[Чтобы прочитать русскую версию статьи, выберите русский в языковом меню сайта.]
Leonid Grigoryev – academic supervisor and tenured professor at the School of World Economy and section head at the CCEIS, HSE University.
SPIN RINC: 8683-3549
ORCID: 0000-0003-3891-7060
ResearcherID: K-5517-2014
Scopus AuthorID: 56471831500
For citation: Grigoryev, L.M., 2024. Key Issues in the Long-Term Growth of the US Economy. Contemporary World Economy, Vol. 2, No 3.
Keywords: United States, inequality, economic growth, financial flows.
This paper was prepared with grant support from the Faculty of World Economy and International Affairs of the HSE University in 2024.
Abstract
The US economy in the 21st century continues to grow along the traditional trajectory, faces old and new problems, experiences external shocks and internal socio-economic difficulties. But the country is growing faster than the European Union and is striving to maintain its leadership in the field of scientific and technological progress. The level of welfare is growing, although the gap between the wealthy strata and the bulk of the population is not diminishing. The electoral process in a two-party political system regularly exacerbates debates on key economic policy issues, resulting in a constantly difficult search for compromises. The 2024 election, which ended with the victory of Donald Trump and the Republican Party, illustrates a significant split in the electorate’s (and elites’) views on social and economic policy and heralds new changes in the way the country’s key challenges are addressed.
The 21st century is not an easy one for the United States and its elites: the country has overcome several severe crises and is undergoing a complex interparty struggle. The presidents of this quarter century have represented very different strands of thought and action. The next administration inherits a significant set of complexities, including high inequality, environmental problems, aging infrastructure, and rising public debt.
The constant sources of benefits for the US economy are the significant inflow of low-cost labor from Latin America and huge capital investments from outside into the US economy. In the last decade, the country has started to actively use industrial policy methods. All this gives high rates of economic growth against the background of other developed countries. But deep social inequality is built into the country’s economic model, even with overall income growth.
Introduction
In the 19th century, the United States experienced faster economic growth than Europe, primarily due to its abundant natural resources, the influx of skilled migrants, and the absence of significant institutional impediments [Grigoryev and Morozkina 2021]. However, a significant turning point in the economic history of the United States occurred in the 1920s, marking a period of considerable divergence in terms of efficiency and productivity from both Europe and the rest of the world [Grigoryev and Morozkina 2021]. During this period, the average annual increase in labor productivity was 4.21%, primarily driven by the large-scale electrification of production processes [Grigoryev, Astapovich 2021. P. 12]. This foundation persisted through the economic downturn of the 1930s and was subsequently put to use. The steady influx of migrants over the past century has consistently supplied the United States with a low-cost labor force and talented individuals nurtured globally. In the last 80 years, numerous countries have made substantial advancements in development, including Japan, Germany, the USSR, and China, enhancing their technological base. However, the United States has consistently maintained a certain “reserve.”
The evolution of the US economy in the 21st century unfolded within a complex series of business cycles. The global financial and economic crisis of 2008–2010, the disruption of global regulatory stability, and the challenges in implementing the United Nations Sustainable Development Goals (SDGs) in 2015 engendered an unstable international environment for the development of the US economy. The business cycle was largely associated with the emergence of financial shocks that stemmed both from the financial system of the US itself and from outside [Grigoryev and Grigoryeva 2020]. The economic policies of presidential administrations were far from uncontroversial. Thus, the authorities’ struggle with economic fluctuations and (starting from the 2020s) inflation itself created the effects of growth attenuation.
The financial crisis of 2008–2010 inflicted substantial damage on the US economy, particularly the housing and financial sectors [Grigoryev 2013]. Originating in the United States, it manifested profound international ramifications. The crisis’s “roots” are multifaceted, originating from imbalances and the accumulation of risks. These preexisting conditions were exacerbated by the mortgage-backed securities crisis, the liberalization of banking regulations, and the bankruptcy of Lehman Brothers in September 2008, a decision that arguably reflected a regulatory misstep.
The magnitude of the US financial system is such that domestic crises in the country have historically exerted substantial negative external influence. However, the nature of the global economy has undergone significant transformation as a result of this crisis. Notably, the growth rate ratio within the group of developed countries has undergone significant changes, with many countries experiencing a decline in their growth rates, thereby leading to an increase in inter-national inequality among the “upper floors.”
The crisis has precipitated a tightening of financial control in the US and worldwide, the emergence of novel regulatory types (“quantitative easing,” among others), and a decline in the intensity of accumulation. However, the most significant, albeit initially unapparent, consequence of the global financial crisis has been the initiation of the dissolution of the existing global regulatory framework (“global governance”). Evidence of this dissolution emerged well in advance of the crisis associated with the COVID-19 pandemic. The Sustainable Development Goals (SDGs), which were established to address pressing global challenges such as poverty, inequality, and climate change, have not yielded substantial progress, both prior to and following the pandemic. Although local changes, including economic successes in some small nations and shifts in energy production structures, have occurred, the overall impact has been negligible.
The United States has not effectively promoted the SDGs, is embroiled in conflicts in Europe and Asia, and is increasingly engaged in competition with China. However, the nation's internal development is predominantly shaped by its own institutions, major corporations, and the private sector, with economic policies aimed at achieving the objectives of the national elite (regardless of party affiliation).The period from 2020 to 2023 witnessed a confluence of factors, including the instability of the global economy and the escalating geopolitical crisis, coinciding with a marked intensification of internal socio-economic (and political) challenges faced by developed countries [Grigoryev, Pavlyushina 2020]. In the United States, this is exemplified by the intensification of divisions (which some perceive as a schism) among active proponents of Republican and Democratic ideologies, reflecting a struggle among prominent business interests.
As evidenced by the outcomes of recent elections, voters are endeavoring to influence the trajectory of events and socio-economic policy. However, the rigidity of party preferences and electoral groups, in conjunction with the intricacies of the electoral system, has culminated in a noteworthy outcome for the evolution of democracy: a select group of voters, numbering in the tens of thousands, residing in “fluctuating” states, wields the capacity to determine the selection of the president, the prevailing party, and the character of public policy. In 2024, the state of the country’s economy was perceived as “neutral” by voters in relation to the election. There was no recession, inflation was relatively low, and unemployment was relatively low. Economic growth and scientific and technological progress in the US remain dynamic, which, given the gigantic size of the economy, remains one of the important pillars of global development as a whole. A notable aspect that garnered minimal attention during the electoral discourse pertains to the national debt, a matter that, in essence, lacked the urgency typically attributed to it within media discourse.
However, the electoral process has culminated, thereby paving the way for a renewed focus on the long-term challenges confronting the nation. The challenges to the US economy’s long-term growth and stability persist, including social and racial inequality, aging infrastructure, mounting public debt, reliance on foreign financial resources, significant military expenditures, and involvement in global tensions and conflicts.
The objective of this paper is to evaluate the state of the US economy in the global context, its potential growth drivers, and the key challenges that the new administration must address. The first chapter of this study examines the United States’ position in relation to other developed countries and leading developing nations. The second chapter focuses on the GDP structure and external sources of development finance. The third chapter addresses the major socio-economic challenges, particularly social inequality, and the prospects for US economic development in the coming years.
1.Parameters of US economic growth against the background of competitors
The long-term economic growth of a nation is determined by a multitude of factors, including the contributions of labor and capital, the advancements in technology, the effectiveness of institutions, and the economic system’s resilience to external shocks. The United States has historically experienced frequent and significant economic crises, yet it has consistently demonstrated resilience in overcoming these challenges. The nation’s unique position within the global economic landscape is characterized by its role as a major hub for labor and financial flows, as well as a significant recipient of scientific and technological advances from domestic and international sources.
The United States has historically experienced a notable degree of scientific and technological progress, largely attributable to its robust R&D expenditures, which account for over 3.5% of its GDP, a figure that exceeds those of its primary competitors. The nation’s ability to attract and retain talent, both domestic and foreign, has also played a significant role in its economic development, contributing to a substantial increase in labor productivity. It is noteworthy that the disparity in labor productivity between the United States and Europe emerged as early as the 1920s. During this period, Europe, particularly Germany and France, was undergoing complex processes that hindered industrial development. In contrast, the US experienced a large-scale economic recovery, significant immigration growth (net inflow of 3 million people), and export growth. The economic boom of the 1920s was punctuated by crises in 1924 and 1927, leading to the perception that the subsequent crisis in 1929 was merely a continuation of a recurring pattern. The Great Depression imposed a substantial economic burden on the United States, yet it did not diminish its competitive edge over European countries. It was not an inevitable occurrence in its extraordinary magnitude [Grigoryev, Astapovich 2021]. Its genesis and progression can be attributed largely to the actions and inactions of the Federal Reserve, as well as the negative ramifications of the 1930 Smoot-Hawley Act on global trade [Greenspan, Wooldridge 2018. P. 266–267]. The crisis, which initially emerged in the United States and subsequently spread to the global developed economy, failed to alter the developmental disparity between the United States and other major economies, including Germany, Japan, and other countries. During the period of World War II, this gap further widened, and it has persisted to the present day.
It is noteworthy that the full implications of the Great Depression were fully realized only in the last ten to fifteen years. The analysis of Ben Bernanke, a future Nobel laureate, applied to the preceding crisis (2008–2010) influenced the nature of anticrisis measures during the 2020s. The measures included a flood of cheap money and fiscal stimulus at the height of the crisis (from spring 2020 onward). This innovative method of crisis management, born out of the previous American experience, yielded favorable results. However, it also resulted in inflation, subsequent interest rate hikes, and macroeconomic regulation difficulties that persist to this day in both the US and the EU.
A cursory examination of aggregate PPP GDP per capita (2021) reveals a stark picture of global economic development over the past two decades, set against the backdrop of several major crises. The United States’ position within this broader context is of particular relevance to our analysis, as it has undergone significant shifts in the last quarter century [Elwell 2006]. As predicted by general theories of economic growth, the US has exhibited a growth rate that is less than that of the most dynamic developing countries but has not lagged significantly behind the largest developing countries taken together (see Table 1). Medium-developed countries, such as Argentina, Brazil, South Africa, and Russia, with their complex recent development histories, are encountering challenges in achieving growth. This phenomenon may be referred to as the “middle-development trap.” Conversely, China, India, and Indonesia are undergoing various stages of industrialization and are demonstrably “catching up.” The rapidity of economic recovery has brought China, for example, closer to the United States in relative terms, as evidenced by a shift from 1.8% ($4,000 PPP per capita to $55,000) to 30.1% ($22,000 to $73,000) (see Table 1). However, the “linear” distance between the two countries has remained at a constant level of $51,000. The salient point of this analysis is not the “mysticism of numbers,” but rather the observation that the American economy, despite domestic challenges and global economic turbulence, has exhibited sustained growth over an extended period.
A comprehensive study of the long-term growth of the United States reveals that the per capita real GDP of this nation has exhibited a growth trajectory over the span of 125 years, with an average annual growth rate of 1.8%, as documented by Elwell (2006. P. 4). The economic progress accumulated since the 19th century has resulted in a substantial disparity between the developed world and countries that have experienced a later onset of development. This phenomenon, characterized by the sustained high growth rates of highly developed countries despite their relatively modest annual growth rates, can be attributed to the accumulation of advantages and the relatively limited impact of catching-up growth by developing countries. This dynamic has been aptly described as “Achilles will never catch up with the Tortoise” [Grigoryev, Maykhrovitch 2023]. This phenomenon is a salient aspect of economic growth theory on a global scale, particularly with regard to achieving the Sustainable Development Goals, specifically Goal 10 (“Reducing Inequality”). In recent decades, however, developed countries have exhibited a multifaceted growth pattern within their respective groupings. In October 2024, The Economist articulated this complex dynamic in an uncharacteristically direct manner: “The US economy has left the rest of the rich countries on the sidelines in the dust” [Rabinovitch, Curr 2024]. The major developed countries shown in Table 1, in contrast to a few developing countries, lagged behind the US over the past 24 years in terms of GDP per capita at PPP, which accounts for currency fluctuations. The linear gap between the US and the EU, which expanded into Central and Eastern Europe during this period but lost the UK, was $15,000 in 2000. By 2023, this gap had grown to $20,000. The distance by this indicator between the US and the UK has doubled, and between the US and Germany has also increased significantly. It is noteworthy that even among the most developed countries and those experiencing rapid economic growth, there has been an observed increase in inequality between nations rather than a significant convergence.
Table 1. GDP dynamics by PPP, 2000–2023
|
GDP per capita (at PPP 2021), thousand dollars. |
Average annual GDP growth (PPP-2021 per capita), % |
||||
|
Country |
2000 |
2011 |
2023 |
2000–2011 |
2011–2023 |
|
US |
55.1 |
60.3 |
73.6 |
0.83 |
1.68 |
|
UK |
44.8 |
48.9 |
54.1 |
0.80 |
0.85 |
|
Germany |
49.8 |
57.7 |
61.6 |
1.35 |
0.59 |
|
France |
47.6 |
51.3 |
55.2 |
0.69 |
0.61 |
|
Japan |
39.2 |
41.2 |
46.3 |
0.45 |
0.97 |
|
EU |
40.5 |
46.5 |
53.8 |
1.28 |
1.22 |
|
Russia |
20.3 |
34.8 |
39.8 |
5.02 |
1.12 |
|
China |
4.0 |
11.2 |
22.1 |
9.83 |
5.85 |
|
Brazil |
13.9 |
18.3 |
18.6 |
2.59 |
0.09 |
|
India |
3.1 |
5.3 |
9.2 |
4.95 |
4.74 |
|
Indonesia |
6.1 |
9.4 |
14.1 |
3.95 |
3.45 |
|
South Africa |
11.3 |
14.6 |
14.3 |
2.38 |
-0.17 |
|
Argentina |
22.4 |
29.8 |
26.5 |
2.63 |
-0.9 |
|
Egypt |
10.2 |
13.4 |
17.0 |
2.46 |
2.01 |
|
Saudi Arabia |
40.4 |
44.7 |
49.6 |
0.91 |
0.87 |
Source: compiled by the author on the basis of the World Bank’s World Development Indicators.
The United States has consistently demonstrated the capacity to allocate its human, financial and technological resources toward supporting the legal framework and the entrepreneurial spirit, thereby facilitating the development of its institutions. While numerous countries have achieved notable advancements in development over the past century, the United States has maintained a substantial lead in terms of per capita output. The configuration of the United States’ economic parameters has exhibited a relatively stable nature, as illustrated in Table 2. Despite high and cyclically fluctuating unemployment, employment has generally increased. Inflation in recent decades (through 2022) can be considered moderate. Public debt has risen substantially (double to GDP), but the essential parameter—its servicing (interest payments)—has been within acceptable limits until recently, especially since a large part of it is held by the Fed. However, from 2023 to 2024, the rise in interest rates on government bonds (in response to inflation) coincided with the “renewal” of the bond stock, transitioning from older, “cheap” bonds to newer, “expensive” ones, which are to be serviced by the Treasury. This transition has led to an increase in debt payments and has exacerbated the debt problem.
Table 2. Key indicators of the US economy by period
|
Period |
1993-2002 |
2003-2012 |
2013-2019 |
2020 |
2021 |
2022 |
|
Real GDP growth, % |
3.4 |
1.9 |
2.3 |
-2.2 |
6.1 |
2.5 |
|
Labor force growth, % |
1.2 |
0.7 |
0.8 |
-1.7 |
0.3 |
1.9 |
|
Unemployment, % |
5.2 |
6.8 |
5.1 |
8.1 |
5.4 |
3.6 |
|
Growth of real private investments in fixed assets, % |
6.8 |
3.4 |
5.6 |
-0.6 |
8.2 |
2.9 |
|
Inflation, CPI, % |
2.5 |
2.5 |
1.6 |
1.2 |
4.7 |
8 |
|
Budget deficit, % of GDP |
-0.6 |
-4.8 |
-3.5 |
-14.9 |
-11.9 |
-5.4 |
|
Personal consumption rate, % |
65.4 |
67.8 |
67.4 |
66.6 |
68.0 |
68 |
|
Savings rate, % |
19.4 |
16.8 |
18.9 |
18.3 |
17.7 |
18.1 |
|
Rates on 10-year government bonds, % |
5.9 |
3.7 |
2.3 |
0.9 |
1.4 |
3 |
|
Public debt, % of GDP |
60.7 |
75.1 |
103.1 |
126 |
120.1 |
119 |
Source: Bureau of Economic Analysis (BEA).
Two salient features of the American economy merit particular attention: a moderate savings rate (up to 20%) and a remarkably high rate of personal consumption in GDP (66–69%). The former, when considered in conjunction with a budget deficit, necessitates external injections. The latter is noteworthy when compared to the prevailing 50–55% of GDP in most regions of the world (with China’s figure standing at approximately 40%). This phenomenon, characterized by a pronounced consumption-based spending pattern, is further accentuated by the unique composition of GDP, amplifying its effect by approximately one-fifth. This amplifying effect ensures a relatively high standard of living without the need for restrictive government spending and accumulation policies.
The imbalance in the GDP formula is counterbalanced by a negative current account balance, which is financed by capital inflows. Figure 1 illustrates the rise in government spending and personal consumption in the 2020s against a backdrop of global turmoil and increasing trade deficits. Figure 1 demonstrates a distinctive and potentially irreproducible set of trends for the 2020s, characterized by a brief decline in personal consumption in 2020 and a rapid rise in nominal consumption following the pandemic (partly due to inflation). Concurrently, there has been a marked surge in government expenditure and a widening of the foreign trade deficit.
Figure 1. US personal consumption, net exports, and government spending, $ billion, 2001–2023
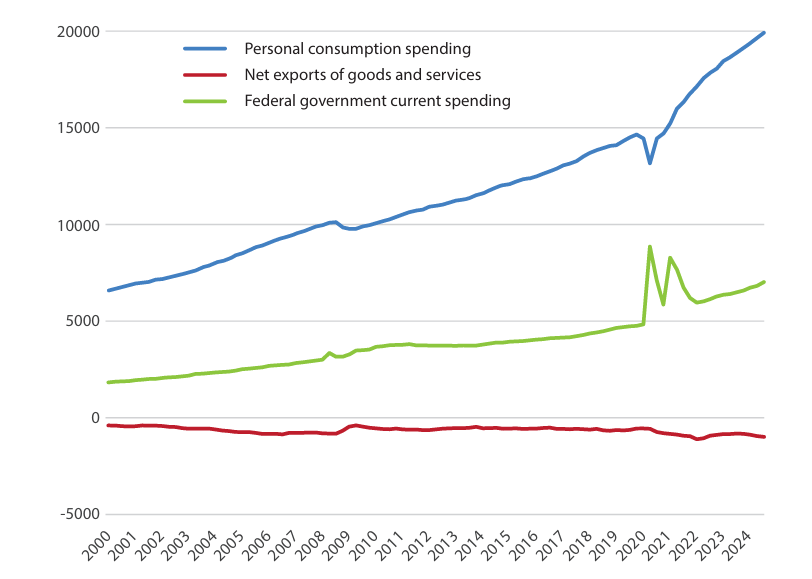
Source: compiled by the author on the basis of World Bank data.
Note: the figure shows the quarterly dynamics adjusted for seasonality.
2. Interaction of the US economy with the external environment
The United States’ economy is substantial in size, constituting approximately one-sixth to one-fifth of the world’s GDP, depending on the measurement approach. It is regarded as an independent analytical entity, and as a substantial economic entity, it naturally interacts with other countries, companies, and international organizations. However, it possesses numerous advantages, including large-scale economic and military power. Consequently, the nation possesses the capacity to influence the institutional and legal framework of the surrounding world, primarily through coalitions with allies, corporate entities, and domestic courts, with the recent addition of administrative decisions by state agencies. Any form of opposition from diverse actors is often perceived as unreasonable and frequently categorized (directly or indirectly) as a violation of the law. The establishment of global regulatory institutions (governance) has a substantial history and theoretical underpinnings [Grigoryev, Kurdin 2013], yet the present discussion does not allow for a comprehensive review of this intricate and compelling subject. It is widely acknowledged that the distinctiveness of the dollar offers considerable benefits for trade and capital attraction. The distinctive role of US financial institutions, notably banks, in conjunction with the presence of international financial organizations within US borders, enables the nation to effectively mediate a substantial proportion of global financial flows, thereby influencing the direction of investments, regulatory oversight, competition policy, and the evolution of its financial system.
American statistics provide a valuable foundation for analyzing the core parameters of its financial system in relation to the broader global context. The ensuing discourse will focus on a comparison of the major financial parameters—assets and liabilities—of the sectors at the conclusion of 2010 and 2023 (refer to Table 3). While some of the highlighted parameters may be considered evident, their values and dynamics are noteworthy.
It is evident that families, albeit indirectly via the financial sector, constitute the primary lender to industry, agriculture, commerce (non-financial sector) and the state. Despite the significant borrowing of households from banks and other financial institutions, pension, insurance and investment funds, bank deposits remain the primary centers of savings concentration and source of credit. The total excess of assets of the household sector over its liabilities amounted to approximately $40 trillion in 2010 and approximately $95 trillion at the end of 2023.
Table 3. Assets and liabilities of sectors of the US economy, 2010–2023.
Data at the end of Q4, trillion dollars and % of GDP (annualized data)
|
2010 |
||||||
|
Obligations |
Assets |
Obligations |
Assets |
|||
|
Households |
Financial sector |
Households |
||||
|
13.3 |
75.1 |
69.1 |
52.4 |
|||
|
87.0% |
490.8% |
451.3% |
342.0% |
|||
|
Non-financial business |
Non-financial business |
|||||
|
14.3 |
28.3 |
|||||
|
93.2% |
Assets |
Obligations |
184.7% |
|||
|
State |
External sector |
State |
||||
|
13.8 |
21.8 |
24.3 |
4.5 |
|||
|
89.8% |
142.2% |
158.6% |
29.2% |
|||
|
2023 |
||||||
|
Obligations |
Assets |
Obligations |
Assets |
|||
|
Households |
Financial sector |
Households |
||||
|
19.2 |
135.95 |
121.7 |
112.5 |
|||
|
68.5% |
486.5% |
435.4% |
402.7% |
|||
|
Non-financial business |
Non-financial business |
|||||
|
28.7 |
60.5 |
|||||
|
102.6% |
Assets |
Obligations |
216.6% |
|||
|
State |
External sector |
State |
||||
|
32.7 |
34.4 |
54.3 |
8.6 |
|||
|
117.1% |
123.1% |
194.1% |
30.9% |
|||
Source:
GDP: BEA. Table 1.1.5. Gross domestic product // https://apps.bea.gov/iTable/?reqid=19&step=2&isuri=1&categories=survey&_gl=1*cu88fg*_ga*MTM4NDI4NzkyNy4xNzI0MTk5NzA1*_ga_J4698JNNFT*MTcyOTAzOTAwMi4xMi4xLjE3MjkwMzkwMDkuNTMuMC4w#eyJhcHBpZCI6MTksInN0ZXBzIjpbMSwyLDMsM10sImRhdGEiOltbImNhdGVnb3JpZXMiLCJTdXJ2ZXkiXSxbIk5JUEFfVGFibGVfTGlzdCIsIjUiXSxbIkZpcnN0X1llYXIiLCIyMDA3Il0sWyJMYXN0X1llYXIiLCIyMDExIl0sWyJTY2FsZSIsIi02Il0sWyJTZXJpZXMiLCJRIl1dfQ==
Liabilities and assets of households (households), domestic financial sector, non-financial corporate business, government (federal government, state and local government): Board of Governors of the Federal Reserve System (US) // https://fred.stlouisfed.org/series/TABSNNCB
External Sector Assets and Liabilities: BEA. Table 1.2. US Net International Investment Position at the End of the Period, Expanded Detail // https://apps.bea.gov/iTable/?reqid=62&step=5&isuri=1&product=5&_gl=1*a7255o*_ga*NDY4OTc5MTI5LjE3MTI4NjA1OTU.*_ga_J4698JNNFT*MTcxMjg2MDU5NC4xLjEuMTcxMjg2MDc5MC42MC4wLjA.#eyJhcHBpZCI6NjIsInN0ZXBzIjpbMSw1LDYsNl0sImRhdGEiOltbInByb2R1Y3QiLCI1Il0sWyJUYWJsZUxpc3QiLCIxNDQiXSxbIkZpbHRlcl8jMSIsWyIwIl1dLFsiRmlsdGVyXyMyIixbIjEiXV0sWyJGaWx0ZXJfIzMiLFsiMCJdXSxbIkZpbHRlcl8jNCIsWyIwIl1dLFsiRmlsdGVyXyM1IixbIjAiXV1dfQ==
The government’s debt reached $9.3 trillion in 2010 and increased by $15 trillion to $24 trillion by the end of 2023. Consequently, the non-financial sector, which encompasses the production of goods and services, has accumulated an additional $14 trillion in debt since 2010, resulting in a total debt of $28.7 trillion by 2023. The government’s liabilities increased by $18.9 trillion (32.7 - 13.8) and the non-financial sector’s liabilities by $14.3 trillion (28.7 - 14.3), for a total of $33.3 trillion over these 13 years. However, it is crucial to examine which sectors provided these resources, as external and population funds clearly played a significant role in this process. The subsequent section of the balance sheet, spanning a 13-year period, is replete with noteworthy developments, which are meticulously delineated in the article [Medzhidova 2024]. The global net investment in the US economy amounted to a mere $2.5 trillion ($24.3 - 21.8) in 2010, and by 2023 it had escalated to an impressive $19.9 trillion ($54.3 - 34.4), representing approximately 70% of GDP.
This phenomenon, characterized by a remarkable degree of global generosity, can be attributed to several factors. Primarily, the United States experienced an excess growth rate during this period, which set it apart from Europe. Additionally, financial risks remained relatively stable, and there was a high demand for financial resources while maintaining a relatively low risk after the financial crisis. It is noteworthy that a significant portion of these funds flowed from various countries worldwide, with Europe contributing the most [Medzhidova 2024]. The policy of quantitative easing, which entailed substantial fiscal injections in 2020, served as a catalyst for the surge in direct investment and credit resources from the EU to the US. In the context of the global search for funds to support the implementation of the Sustainable Development Goals (SDGs) in developing countries and the efforts to combat climate change, a significant portion of global savings is allocated to the US, a nation that lacks domestic savings to support growth and financing of government expenditures. This phenomenon, as Marxists would have theorized in the past, can be attributed to two main factors: global instability and the EU’s economic policy missteps. It is noteworthy that certain theorems concerning the regularities of capital flows appear to be inapplicable in this particular instance, even in their most basic forms. The influx of capital from Europe and other regions to the United States, as evidenced by the Ministry of Finance and the Federal Reserve System’s anti-crisis injections, has contributed to an increase in capital flight. In the 2020s, direct and portfolio investments began to shift from high-risk regions to the US, despite the US having only half a point to a point higher interest rates on long-term bonds than Europe.
The substantial inflow of financial resources into the US over the past thirteen years coincided with an influx of migrants, while maintaining a high level of R&D expenditures. These expenditures ensured an increase in the efficiency of capital investments. The housing cycle, subsequent to the 2001–2005 boom, plays an autonomous and pivotal role. Approximately 2% of GDP is allocated to intellectual capital assets, ensuring that the modest rate of accumulation (less than 20%) contributes to GDP growth. This is a salient autonomous factor in augmenting the share of personal consumption, though a more profound examination is warranted.
The elevated values of the negative trade balance warrant elucidation. As illustrated in Table 4, these figures amount to 3–4% of GDP annually, representing the “commodity contribution” of the global economy to the welfare of the US and the sustenance of a high level of personal consumption.
Table 4. Macroeconomic parameters, 2000–2023
|
Country |
Exports (in % of GDP) |
Imports (in % of GDP) |
Consumer price index (100=2010) |
Unemployment (% of labor force) |
||||||||
|
2000 |
2010 |
2023 |
2000 |
2010 |
2023 |
2000 |
2010 |
2023 |
2000 |
2010 |
2023 |
|
|
US |
10.7 |
12.3 |
11.1 |
14.4 |
15.9 |
13.9 |
79 |
100 |
139.7 |
3.99 |
9.63 |
3.63 |
|
UK |
25.7 |
28.9 |
32.2 |
26.9 |
30.4 |
33.4 |
81.5 |
100 |
142.7 |
5.56 |
7.79 |
4.05 |
|
Germany |
30.8 |
42.6 |
47.1 |
30.7 |
37.3 |
43 |
85.7 |
100 |
131.9 |
7.92 |
6.97 |
3.04 |
|
France |
28.6 |
26.8 |
32.7 |
27.3 |
28.1 |
34.9 |
84.4 |
100 |
124 |
10.22 |
9.28 |
7.32 |
|
Japan |
10.5 |
14.9 |
17 |
9.1 |
13.6 |
24 |
103 |
100 |
111.4 |
4.75 |
5.1 |
2.58 |
|
EU |
35.7 |
40.3 |
52.7 |
34.9 |
38.7 |
49 |
- |
100 |
130 |
9.8 |
9.9 |
6.0 |
|
Russia |
44.1 |
29.2 |
23.1 |
24 |
21.1 |
18.7 |
30.8 |
100 |
- |
10.6 |
7.4 |
3.3 |
|
China |
20.9 |
27.2 |
19.7 |
18.5 |
23.5 |
17.6 |
81 |
100 |
132.2 |
3.26 |
4.53 |
4.67 |
|
Brazil |
10.2 |
10.9 |
18.1 |
12.5 |
11.9 |
15.7 |
52.5 |
100 |
213.9 |
10.9 |
8.4 |
8 |
|
India |
13 |
22.4 |
21.9 |
13.9 |
26.9 |
24 |
54.3 |
100 |
216.9 |
7.9 |
8.3 |
4.2 |
|
Indonesia |
41 |
24.3 |
21.7 |
30.5 |
22.4 |
19.6 |
44 |
100 |
169.1 |
6.1 |
5.6 |
3.4 |
|
South Africa |
24.4 |
25.8 |
33 |
21.8 |
24.6 |
32.7 |
59.9 |
100 |
194.8 |
19.8 |
23.2 |
28 |
|
Argentina |
11 |
18.9 |
12.9 |
11.6 |
16 |
14.1 |
- |
100 |
124 |
15 |
7.7 |
6.2 |
|
Egypt |
16.2 |
21.3 |
19.1 |
22.8 |
26.6 |
21.3 |
45.1 |
100 |
486.3 |
8.98 |
8.76 |
7.31 |
|
Saudi Arabia |
43.4 |
49.6 |
34.7 |
24.8 |
33 |
27.4 |
76.7 |
100 |
132.4 |
4.57 |
5.55 |
4.88 |
Source: compiled by the author on the basis of the World Bank’s World Development Indicators.
As demonstrated in Table 4, the United States is characterized by relatively moderate inflation and unemployment rates, with the exception of the years during the crisis. Consequently, the country’s substantial market holds greater appeal due to its increased stability compared to that of its primary partners. This enhanced appeal is further bolstered by the presence of critical factors conducive to foreign investment inflows, including the long-term reliability of the legal environment and the absence of stringent climate policies [Esayan 2024]. As expected, 79% of foreign direct investment in 2022 originated from Canada and European developed countries, and 65% of US FDI outflows were directed to these regions [ERP 2024. P. 189]. The US predominantly offers at an acceptable level and the majority of macro-parameters. The dynamics of foreign trade, particularly the exchange rate of the US currency, is of particular significance [Flores 2024].
Consequently, a notable equilibrium has emerged in the global commodity and financial markets, wherein the most developed nation worldwide receives a substantial influx of financial resources while maintaining an unusually high share of personal consumption in GDP. It is noteworthy that the scientific community has adopted a relatively indifferent stance in the face of this phenomenon, yet they have demonstrated unwavering commitment to identifying strategies to address issues such as poverty, climate change, and the financing of sustainable development. It is evident that the substantial influx of funds between major regions, rather than being invested in developing countries, serves as a mechanism that exacerbates inequality. The proposal by Mario Draghi to allocate nearly a trillion dollars to the EU competitiveness program appears to be a desperate attempt to focus on the apparent benefits rather than the underlying issues [Draghi 2024].
3.Challenges for the US economy in the medium term
The United States’ economy has historically enjoyed the benefits of scientific and technological progress, a substantial accumulation of economic potential, considerable economic and military strength, and specific features of its financial sector. However, the period from 2020 to 2024 presented significant challenges. In comparison to the European Union, which has maintained its dominant position in the global economy, the United States has fared considerably better. However, the nation is grappling with a series of intricate challenges, the resolution of which often necessitates substantial financial investments or is impractical within the confines of a single or two presidential terms. This article does not aspire to comprehensively address the intricacies of the US economy or to compile extensive lists of issues. Instead, it will direct its focus to a select number of critical concerns that are likely to be prioritized by the incoming president. In light of the geopolitical turbulence, domestic and international conflicts, pandemics, and natural disasters that have engendered a downward spiral in recent years, it would be prudent for a major economic power to allocate its financial resources toward the restoration of peace and global institutional order, the resolution of private conflicts, and the provision of aid to victims. However, this is a distant prospect, and it is unlikely that politicians will seek counsel from social scientists on these matters.
The discussion of the socio-economic challenges confronting the nation can be initiated with a focus on infrastructure. The period of mass construction of roads, bridges, and dams in the United States, which began in the 1960s and continued through the 1970s, is nearing the end of its useful life. For all types of infrastructure, the actual life spans (40–50 for structures and 20–30 for highways and railroads) are nearing their end, while dams and highways are already overbuilt. Renewing these infrastructure elements is estimated to require an investment of approximately one trillion dollars, with no imminent commercial return anticipated [Zhao et al. 2019]. The dam failure incident in New Orleans is a salient example that is often disregarded in discourse. The Infrastructure Investment and Jobs Act (IIJA) was enacted on November 5, 2021, garnering bipartisan support. While the legislation is expected to stimulate investment in this sector, the allocated funds are considered inadequate. The annual funding required is estimated at approximately 2.4% of GDP, yet the Act itself stipulates a budget of $65 billion.1 Recent hurricanes along the Atlantic coast, the escalating frequency of typhoons, droughts, and floods, attributable to climate change, are anticipated to result in future adaptation expenditures. Mitigating climate change is a challenging prospect, and the US climate program itself remains modest in scale [Esayan 2024]. A similar situation is observed in the energy sector, where the need for development and restructuring is evident. However, the United States has successfully addressed another challenge by achieving self-sufficiency in shale oil and gas. The United States has achieved energy independence, with its energy balance consisting of 80.5% hydrocarbons [Kheifets 2024].
The defense of a highly liberalized economy by US policymakers is readily reconcilable with a persistent industrial policy. This commitment is evidenced by the subsidization of research in the domain of shale hydrocarbons, as well as legislation such as the CHIPS Act, the Infrastructure Investment and Jobs Act (IIJA), and the Inflation Reduction Act (IRA) [Galbraith 2024].
Notably, the Inflation Reduction Act allocates substantial subsidies for the production of electric vehicles, in conjunction with the imposition of 100% duties on imports of Chinese electric vehicles, as approved in May. These measures, when viewed through the lens of international trade liberalization, appear controversial. Moreover, the surge in tariffs on all imports, a proposal that emerged during D. Trump’s election campaign, poses significant risks. This is particularly concerning when we draw parallels with the 1930 Smoot-Hawley Act, which led to the collapse of international trade and further exacerbated the domestic crisis in America, ultimately contributing to the onset of the global Great Depression. While the likelihood of such an outcome is low in the current economic climate, a systematic escalation in the cost of imports, which play a substantial role in domestic consumption, will undoubtedly have a detrimental effect on consumers and businesses.
The issue of industrial policy extends beyond customs tariffs and subsidies in select economic sectors. The primary challenge confronting developed and medium-developed countries is manufacturing. For numerous nations, it proves to be a formidable challenge to transform their revenues from natural resource exports into the acquisition of goods from their own industry, with the objective of enhancing its efficiency and competitiveness. Instead, these revenues often find their way into the markets of consumer goods exporting countries, thereby satisfying the domestic demand of commodity exporters (a circumstance exemplified by Russia and Brazil). Paradoxically, the elevated cost of labor and the accessibility of inexpensive imports have engendered a comparable outcome for the US, manifesting in the form of a substantial trade deficit. Figure 2 demonstrates that the nation’s industrial sector has exhibited relatively modest growth in comparison to its GDP over the past twenty-five years, particularly in the context of the expansion of hydrocarbon production.
Figure 2. Dynamics of real GDP, gross capital investment, and industrial production in the United States from 2007 to Q2 2024, quarterly data, 2017=100
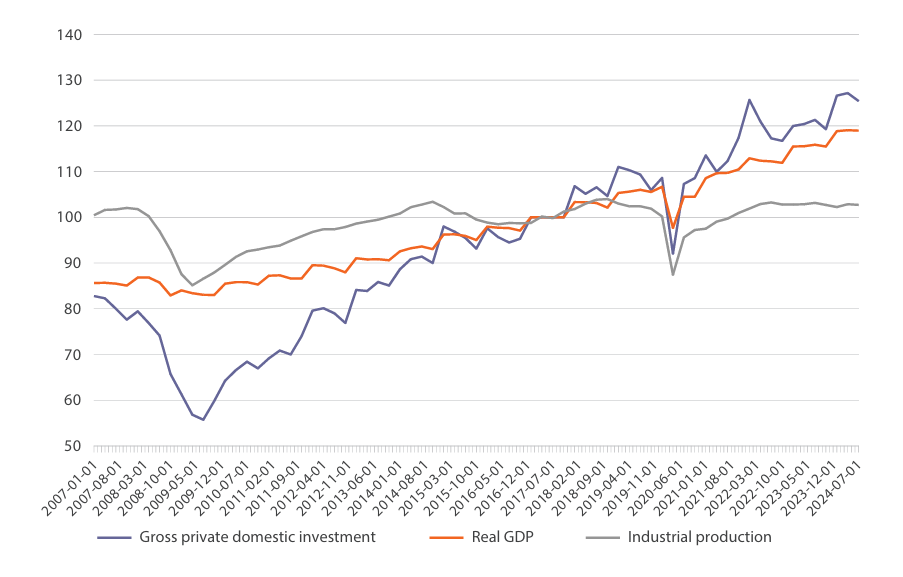
Source: compiled by the author on the basis of FRED data.
One of the country’s problems, around which many academic and political lances have been broken, is the problem of reindustrialization, which the US has de facto embarked on, and which has to do with the future of employment, technology, and exports. An incoming president can both gain the support of many economists for industrial policy for the sake of creating jobs and supporting the middle class, future technological leadership, and maintaining competitiveness, and face criticism of specific plans. Hence the characteristic titles of recent articles by prominent American intellectuals: “America has no alternatives to industrial policy” [DeLong 2024]; “Industrial policy is a good idea, but so far we don’t have one” [Galbraith 2024]. These approaches are in line with the positions of many representatives of business and political elite. But the question is to what extent such a policy can be developed and harmonized taking into account the macroeconomic processes.
Table 5. Parameters of the state budget, R&D expenditures and inequalities
|
Country |
Public expenditures as % of GDP |
State revenues as % of GDP |
R&D expenditures as % of GDP |
Share of 10th decile as % of GDP |
Military expenditures as % of GDP |
||||||||||||
|
2000 |
2010 |
2022 |
2000 |
2010 |
2022 |
2000 |
2010 |
2022 |
2000 |
2010 |
2022 |
2000 |
2010 |
2022 |
|||
|
US |
33 |
39.8 |
37 |
35 |
28.8 |
32.7 |
2.6 |
2.7 |
3.5 |
30.3 |
29.3 |
30.2 |
3.1 |
4.9 |
3.5 |
||
|
UK |
34 |
44.7 |
44.4 |
35.3 |
35.5 |
39.7 |
1.6 |
1.6 |
2.8 |
31.1 |
26.4 |
24.6 |
2.4 |
2.6 |
2.2 |
||
|
Germany |
47.8 |
48.1 |
49.5 |
46.2 |
43.8 |
47 |
2.4 |
2.7 |
3.1 |
22.9 |
24.0 |
25.0 |
1.4 |
1.3 |
1.4 |
||
|
France |
51.7 |
56.9 |
58.3 |
50.3 |
50 |
53.5 |
2.1 |
2.2 |
2.2 |
25.4 |
27.1 |
24.9 |
2.1 |
2.0 |
1.9 |
||
|
Japan |
35 |
38 |
42 |
28.7 |
28.7 |
37.6 |
2.9 |
3.1 |
3.7 |
- |
25.7 |
- |
0.9 |
0.9 |
1.1 |
||
|
EU |
47.1 |
51 |
50 |
46.1 |
39 |
41 |
1.8 |
2.0 |
2.3 |
- |
- |
- |
1.7 |
1.5 |
1.6 |
||
|
Russia |
30.7 |
35.5 |
35.5 |
33.8 |
32.3 |
34.2 |
1 |
1.1 |
0.9 |
27.6 |
30.6 |
- |
3.3 |
3.6 |
4.1 |
||
|
China |
16.3 |
25.1 |
33.5 |
13.4 |
24.7 |
26 |
0.9 |
1.7 |
2.6 |
29.4 |
32.6 |
28.2 |
1.8 |
1.7 |
1.6 |
||
|
Brazil |
34 |
42.2 |
45.6 |
31 |
39.1 |
42.6 |
1.1 |
1.2 |
- |
46.5 |
41.7 |
41.0 |
1.7 |
1.5 |
1.1 |
||
|
India |
26 |
28 |
29 |
18 |
19 |
20 |
0.8 |
0.8 |
0.7 |
28.3 |
29.9 |
25.0 |
2.9 |
2.9 |
2.4 |
||
|
Indonesia |
15.3 |
16.9 |
17.4 |
13.4 |
15.6 |
15.2 |
0.1 |
0.1 |
0.2 |
25.0 |
29.5 |
30.7 |
0.7 |
0.6 |
0.7 |
||
|
South Africa |
22.7 |
28.3 |
32 |
21.3 |
23.8 |
27.7 |
0.6 |
0.7 |
0.9 |
44.9 |
51.3 |
- |
1.4 |
1.0 |
0.7 |
||
|
Argentina |
25.3 |
33.4 |
37.8 |
21.8 |
32 |
34 |
0.4 |
0.6 |
0.5 |
37.7 |
31.8 |
29.8 |
1.1 |
0.8 |
0.4 |
||
|
Egypt |
26 |
31.4 |
24.7 |
27.3 |
23.9 |
18.9 |
0.2 |
0.4 |
1 |
26.4 |
27.0 |
27.5 |
2.6 |
2.0 |
1.1 |
||
|
Saudi Arabia |
33.1 |
33 |
28.3 |
36.3 |
37.4 |
30.7 |
0.1 |
0.9 |
0.5 |
- |
- |
- |
10.5 |
8.6 |
7.4 |
||
Source: calculated by the author according to IMF and World Bank data.
A comparative analysis of the US budget deficit reveals that, in percentage terms, it does not appear to be as dramatic as that of other countries. It is important to note, however, that many countries worldwide have substantial regular deficits. Nevertheless, when assessed in absolute terms, the US deficit stands as the most significant, resulting in a considerable debt. This deficit necessitates substantial savings to purchase additional bond issues from the Treasury Department and significant revenues to service it. The rising interest rates anticipated in 2024, as previously mentioned, position the servicing of the US national debt on par with military spending. The United States’ military spending is significantly higher than that of other countries, yet the country’s R&D spending, particularly by businesses, is also high. The intricate dynamics of financial flows in the US make it challenging to ascertain the allocation of capital inflows from external sources, whether for technical or military expenditures or personal consumption.
The perennial issue of servicing the national debt and setting the national debt ceiling is a point of interparty contention in the United States, although it is often characterized by observers as less significant than it truly is. However, the favorable state of the country’s economy has noticeably weakened the role of this topic in the electoral struggle, giving way to concerns about the return of inflation. This shift in focus is evidenced by the abandonment of the debt ceiling discussion by both parties, a strategic move aimed at avoiding any potential voter backlash against the prospect of a government shutdown. The anticipated global economic downturn in 2023 failed to materialize. The future state of macroeconomic indicators, finance, and industrial policy will be contingent on the evolution of the geopolitical landscape, oil prices, and the business cycle, as well as the realization of a set of political election promises that will translate into government spending [Grigoryev 2024].
The growth of debt is projected to continue, accompanied by a robust discourse surrounding the definition of debt and the threshold of excessive debt. The low interest rates on government bonds serve to minimize the significance of the debt’s size. Conversely, a successful macroeconomic policy aimed at maintaining inflation control could potentially enable the Federal Reserve to assist the Ministry of Finance in further augmenting government spending and debt. Projections of debt service prospects in the ensuing years do not appear to be cause for alarm (see Appendix). The International Monetary Fund (IMF) generally regards the US fiscal situation as relatively stable, a stance that contrasts with the historical reality [IMF 2024]. However, as Barry Eichengreen asserts, “America’s debt is both sustainable and a problem” [Eichengreen 2024].
Finally, social challenges and impediments to development persist. Table 5 demonstrates that social inequality in the US is “persistent”—the 10th decile’s share of national income exceeds that of most developed countries and shows no decline. The nature of the Anglo-Saxon type of inequality, characterized by higher rates of inequality compared to those observed in continental Europe, is attributed in part to the presence of strong vertical elevators. The pursuit of personal success motivates individuals to work, leading to a perception that inequality is both persistent and mild over time. For many immigrants, the term “poverty in America” signifies living conditions that are noticeably better than the level of prosperity in their home countries. The continuous influx of Hispanic individuals contributes to a steady influx of low-wage labor, which is comparatively lower than that of “traditional whites.” However, it should be noted that they do pose a substantial competition to the African labor market.
The persistent disparity in per capita incomes among various ethnic groups (Asians, Whites, Hispanics, and African Americans) is a distinctive American phenomenon that has persisted for decades, despite the overall growth in income. In 2023, the Asian community demonstrated remarkable success, with a median income that surpassed the national average of $95,000 per year per household by a substantial margin of 21%. This represents a significant improvement from the 19% excess observed in 2002, when the median income was $70,000. By 2023, median incomes for Whites remained below the average, though the difference was minimal, at 6%. However, the situation for Hispanic families has seen a marked deterioration, with a shift from -21% to -31% of the overall median (from $55,000 to $65,500). The position of African-American families on this indicator also underwent a deterioration, from -33% to -41% (from $47,000 to $56,000) [Petrovskaya 2024]. While the overall level of well-being has shown improvement, the relative inequality has deteriorated significantly.
The state has allocated substantial resources to equalizing conditions for children, education, and other channels to reduce inequality, yielding results, but not enough to meaningfully improve the situation. But, as observed in [Grigoryev, Grigoryeva 2021], the persistent disparities between ethnic groups, which are a component of social inequality, are increasingly impacting the socio-political environment and electoral processes. The growing demographic of Latinos and the Asian population will inevitably bring about changes to these processes. Nevertheless, it is imperative to recognize that the resolution of this issue cannot be solely attributed to an increase in budgetary expenditures. This is a profound societal transformation, the nature of which remains opaque.
Conclusion: Impact on the world
The United States’ distinctive position in the global economy is rooted in its historical isolation from European and Asian conflicts, as well as the influx of labor, talent, and financial resources over two centuries. In the context of an anticipated slowdown in growth during the 2020s [Kose, Ohnsorge 2023], the ability of the United States to maintain its current growth rate and the manner in which it does so will be a pivotal factor. The economic turbulence and financial shocks of recent decades have not negated the advantages of the dollar system, nor have they impeded the influx of migrants and foreign capital seeking safe haven. This US specificity has catalyzed economic growth and augmented the country’s prosperity, as well as enabled a divergence from countries lacking such opportunities. However, the concomitant problems are also entrenched to a degree that cannot be resolved within the conventional swings of bipartisan politics and short electoral cycles. These challenges encompass the persistent economic disadvantage experienced by significant segments of the population, particularly those of African descent; the evolving ethnic composition of the population, influenced by migration patterns; the deteriorating infrastructure; and the reliance on substantial migration and external financial injections to fuel economic growth. The systemic support for Anglo-Saxon-type inequality within the nation’s institutions underscores the enduring presence of these issues and their potential to persist as significant social challenges in the United States in the coming years.
Bibliography
DeLong, J. B., 2024. America Has No Alternative to Industrial Policy. Project Syndicate, Sept. 5. Available at: https://www.project-syndicate.org/commentary/industrial-policy-now-necessary-even-if-one-accepts-standard-argument-against-it-by-j-bradford-delong-2024-09
Draghi, M., 2024. The future of European competitiveness. European Commission. Р. 1–69. Available at: https://commission.europa.eu/document/download/97e481fd-2dc3-412d-be4c-f152a8232961_en
Economic Report of the President (ERP), 2024. Washington, DC: The White House. Available at: https://www.whitehouse.gov/cea/economic-report-of-the-president/
Eichengreen, B., 2024. America’s Debt Is Both Sustainable and a Problem. Project Syndicate, June 11. Available at: https://www.project-syndicate.org/commentary/imf-says-us-debt-is-sustainable-but-predictions-have-risks-by-barry-eichengreen-2024-06
Elwell, K.C., 2006. Long-term Growth of the US economy: Significance, Determinants, and Policy (Updated May 25, 2006). Congressional Research Service.
Esayan, M., 2024. US Emissions and Climate Policy: National and State Trends. Contemporary World Economy, Vol. 2, No 3.
Flores, R., 2024. Replacing the Dollar in International Payments: A Preliminary Assessment. Contemporary World Economy, Vol. 2, No 3.
Galbraith, J. K., 2024. Industrial Policy Is a Good Idea, but So Far We Don’t Have One. Intereconomics.org. Available at: https://www.ineteconomics.org/perspectives/blog/industrial-policy-is-a-good-idea-but-so-far-we-dont-have-one
Greenspan, A., Wooldridge, A., 2018. Capitalism in America: A History. Penguin Press.
Grigoryev, L.M., 2013. The USA: Three socio-economic problems. Voprosy Ekonomiki, No 12, P. 48-73 (in Russian).
Grigoryev, L.M., 2024. The Spring of Reckoning: How International Economic Organizations Are Changing Their Vision of the Future of the Global Economy. Contemporary World Economy, Vol. 2, No 1.
Grigoryev, L. M., Astapovich, A.A., 2021. From the Great Depression to Systemic Reforms. Russia in Global Affairs, Vol. 19, No 1, P. 104–119 (in Russian).
Grigoryev, L., Grigoryeva, N., 2020. Economic dynamics and electoral behavior. In: The Trump phenomenon / edited by A.V. Kuznetsov. Chap. 3.4. Moscow: INION.
Grigoryev, L.M., Grigoryeva, N.L., 2021. U.S. economy and social structure before the change of eras. Voprosy Ekonomiki, No 1, P. 98–119 (in Russian).
Grigoryev, L.M., Kurdin, A.A., 2013. Mechanisms of Global Governance: Economic Analysis. Voprosy Ekonomiki, No 7, P. 4–28.
Grigoryev, L.M., Maykhrovitch, M.Y., 2023. Growth theories: The realities of the last decades (Issues of sociocultural codes — to the expansion of the research program). Voprosy Ekonomiki. No 2. P. 18-42. Available at: https://doi.org/10.32609/0042-8736-2023-2-18-42 (in Russian).
Grigoryev, L.M., Morozkina, A.K., 2021. Successful unsustainable industrialization of the world: 1880-1913. Moscow: Nestor-Istoria (in Russian).
Grigoryev, L., Pavlyushina, V., 2020. Global Recession and Income Inequality: Factors of Disruption for Elites in the Twenty-first Century. In: Global Governance in Transformation: Challenges for International Cooperation / L. Grigoryev, A. Pabst (eds.). Cham: Springer.
IMF, 2024. United States of America Staff Concluding Statement of the 2024 Article IV Mission. June 27. Available at: https://www.imf.org/en/News/Articles/2024/06/27/cs62724-united-states-concluding-statement-of-the-2024-article-iv
Kheifets, E., 2024. Trends in the Development of the US Sector. Contemporary World Economy, Vol. 2, No 3.
Kose, M. A., Ohnsorge, F., 2023. Falling Long Growth Prospects: Trends, Expectations, and Policies. The World Bank. Available at: https://thedocs.worldbank.org/en/doc/99d9eb60c30495e30f856de1467d34b8-0360012023/original/Long-Term-Growth-Prospects-for-circulation.pdf
Medzhidova, D., 2024. The International Investment Position of the United States in the Twenty-First Century. Contemporary World Economy, Vol. 2, No 3.
Petrovskaya, N., 2024. Transformation of the Ethnic Structure of the US Electorate. Contemporary World Economy. Vol. 2, No 3.
Rabinovitch, S., Curr, H., 2024. The American economy has left other rich countries in the dust. The Economist, Oct. 14. Available at: https://www.economist.com/special-report/2024/10/14/the-american-economy-has-left-other-rich-countries-in-the-dust?ysclid=m2j2f70r29611916121
Zhao, J.Z., Fonseca-Sarmiento, C., Tan, J., 2019. America’s Trillion-Dollar Repair Bill: Capital Budgeting and the Disclosure of State Infrastructure Needs. The Volcker Alliance, W.P. Р. 1-54.
Appendix: US forecast through 2029 (June 2024, %).
|
2022 |
2023 |
2024 |
2025 |
2026 |
2027 |
2028 |
2029 |
|
|
Real GDP (annual growth) |
1.9 |
2.5 |
2.6 |
1.9 |
2.0 |
2.1 |
2.1 |
2.1 |
|
Unemployment rate (q4 average) |
3.6 |
3.7 |
4.2 |
4.3 |
4.3 |
4.2 |
4.0 |
3.9 |
|
Current account balance (% of GDP) |
-3.8 |
-3.0 |
-2.9 |
-2.8 |
-2.5 |
-2.2 |
-1.9 |
-1.6 |
|
Federal funds rate (end of period) |
4.4 |
5.4 |
5.1 |
4.1 |
3.1 |
2.9 |
2.9 |
2.9 |
|
Ten-year government bond rate (q4 avg.) |
3.8 |
4.4 |
4.1 |
3.5 |
3.3 |
3.2 |
3.2 |
3.2 |
|
PCE inflation (q4/q4) |
5.9 |
2.8 |
2.4 |
1.8 |
1.9 |
1.9 |
1.9 |
1.9 |
|
Federal government fiscal balance (% of GDP) |
-5.4 |
-6.3 |
-6.8 |
-6.6 |
-6.1 |
-5.4 |
-5.6 |
-5.3 |
|
Federal government debt held by the public (% of GDP) |
95.8 |
97.3 |
99.2 |
102.1 |
104.7 |
106.3 |
108.1 |
109.5 |
|
General government fiscal balance (% of GDP) |
-4.1 |
-7.6 |
-7.8 |
-7.6 |
-7.2 |
-6.7 |
-6.7 |
-6.5 |
|
General government gross debt (% of GDP) |
119.8 |
120.7 |
123.2 |
126.7 |
129.6 |
131.8 |
134.0 |
135.9 |
Source: BEA; BLS; Haver Analytics; and IMF staff estimates.
Notes
1 https://www.whitehouse.gov/wp-content/uploads/2022/05/BUILDING-A-BETTER-AMERICA-V2.pdf#page=385

1.jpg)
