
Trends in the Development of the US Energy Sector
[Чтобы прочитать русскую версию статьи, выберите русский в языковом меню сайта.]
Ekaterina Kheifets — an independent expert.
ORCID: 0000-0001-5532-2240
ResearcherID: rid91298
Scopus AuthorID: 57879402000
For citation: Kheifets E.A., 2024. Trends in the Development of the US Energy Sector. Contemporary World Economy, Vol. 2, No 3.
Keywords: energy markets, climate regulation, energy security, investments, shale production.
Abstract
The paper examines the historical prerequisites of the formation of the US fuel and energy sector. Over the past century, the United States has experienced numerous large-scale economic and energy market shocks, which have led to the prioritization of achieving energy security at the national level. The article considers geographical structure of oil and gas trade, as well as domestic sectoral demand. The study assesses the potential ramifications of a novel industrial policy on domestic energy demand and undertakes a comprehensive analysis of the investment cycle of oil and gas companies, which exhibits a notable sensitivity of capital investments to price dynamics. The study also noted the insignificant impact of the climate lobby on emission levels and demand for fossil fuels.
Introduction
The global energy market is once again undergoing a period of major transformation, driven by geopolitical uncertainty, technological developments, and climate regulation. The United States is a major consumer and producer of energy on the global market. The assumption of office by President Donald Trump is anticipated to result in a substantial realignment of US energy policy, thereby transforming global commodity market. Predictable consequences of this shift include the following: a reduction in barriers for US oil and gas producers, a significant weakening of climate regulation, and a reduction in subsidies for electric vehicles and renewable energy production.
Despite the pledges made by various nations to curtail their consumption of fossil fuels, OPEC anticipates an escalation in global consumption of both oil—up to 102.1 Mboe in 2030 (+11% by 2023)—and gas—up to 75.9 Mboe in 2030 (+9.8% by 2023), but mainly driven by developing countries [OPEC 2024]. The escalating prices of oil and gas on a global scale, the prevailing state of geopolitical turbulence, and the increased demand from the EU amid attempts to replace Russian energy resources signify the likelihood of an augmentation in domestic oil and gas production within the US. The recently implemented industrial policy under the administration of President Joseph Biden serves to invigorate domestic demand. In this regard, it is imperative to take into account the historical background and prevailing conditions of the US energy market, as well as its role as a pivotal supplier and consumer of fuel.
History of the US energy sector transformation
The modern approach to the study of the global energy sector identifies four stages of market formation [Grigoryev, Kheifets 2022]:
1. 1868—1915: the period is characterized by low dependence of the world economy on oil, low cost of energy production, Standard Oil monopoly.
During this period, coal constituted the primary source of energy in the US amid the ongoing industrialization. Coal played a pivotal role in the production of steel, the generation of electricity, and the creation of employment opportunities. The primary coal mining regions were Pennsylvania, West Virginia, Illinois, and Kentucky. Coal mining in Pennsylvania commenced in the mid-1700s to supply the colonial steel industry. By the early 1800s, the coal from Pennsylvania had contributed to industrial growth throughout the country and had become the primary fuel for the growing steel industry in western Pennsylvania. The advent of the railway network in the early 20th century further facilitated the extraction of the abundant coal deposits found in the Appalachian region, which spanned West Virginia, Kentucky, and Virginia. Since the onset of this period, the aforementioned states have collectively contributed to half (54%) of the nation’s total coal production. Presently, Pennsylvania alone accounts for 20% of the nation’s coal production. In the late 19th century, commercial coal mining operations expanded westward beyond the Mississippi River, with significant activity observed in Texas, Montana, Colorado, Utah, North Dakota, New Mexico, and Wyoming. In the contemporary times, Wyoming has emerged as the leading producer of coal in the United States.
Following the end of the Civil War in the US, the demand for kerosene escalated, thereby augmenting the share of oil in the nation’s energy balance. The discovery of the Spindletop field in 1900 signaled the beginning of the boom in the US oil industry. The industry’s primary catalyst was Standard Oil, which, through strategic agreements aimed at reducing the cost of railroad transportation, established a monopoly in the country’s oil market for over 40 years. However, in 1911, under the Sherman Antitrust Act of 1890 Standard Oil’s monopoly was dissolved through the establishment of 34 new companies, including Standard Oil of New Jersey (later Exxon), Standard Oil of New York (later Mobil), Standard Oil of California (later Chevron), and Standard Oil of Ohio (which in 1987 was acquired by British Petroleum, which in 1988 also purchased Standard Oil of Indiana). These companies subsequently became members of the later emerged Seven Sisters. During this period, the US was one of the largest exporters of oil. Prior to World War I, the US accounted for 60% of global oil production, the Russian Empire accounted for 20% (during the period 1889–1901, it was the world’s largest oil producer), along with that Mexico, the Dutch East Indies, and British India accounted for 2% to 5% of global oil production [Rubio-Varas 2006].
2. 1915–1972: the period is characterized by low import prices for energy resources, the monopoly of the Seven Sisters, with coal still occupying a key place in the US energy balance (during this period the US is also the world’s largest coal producer), since the 1950s oil has become the most consumed fuel in the country.
The war underscored the significance of ensuring the nations’ energy security. Large coal producers were in a strategic advantage over the rest of the world, and the development of domestic coal deposits became a high priority for many governments. With the growing demand for oil during World War I, the US began importing oil from Mexico for the first time. By 1920, the price of oil had reached to US$ 3/bbl (compared to US$0.67/bbl in 1914).
In response to the challenges associated with meeting the escalating oil demand, Congress enacted the Mineral Leasing Act in 1920. This legislation established the framework for the leasing of federal lands for the purpose of oil exploration. This legislative response was underpinned by concerns regarding the protectionist policies of Britain and France concerning their Middle Eastern oil interests. The act included a provision that prohibited foreign companies, whose governments did not grant similar rights to US firms, from accessing US mineral rights. Concurrently, US oil companies initiated a campaign to secure concessional oil production in Latin America.
The year 1928 is considered as the year of formation of the Seven Sisters (the world’s largest oil producers, which included Exxon, Mobil, Chevron, Texaco, British Petroleum, Gulf Oil, and Royal Dutch Shell), resulted from the signing of the Red Line Agreement, which provided for joint oil production activities in the Persian Gulf. In 1933, the United States (Standard Oil Company of California, or Chevron) also signed a concessional agreement with Saudi Arabia, creating the California Arabian Standard Oil Company (later Saudi Aramco). It should be noted that the cartel constituted the foundation for the contemporary global energy infrastructure. Until 1973, it met the substantial oil demand of Western nations at a relatively affordable cost.
Subsequent to World War II, oil replaced coal as the predominant source of energy in the majority of industrialized nations, including the US. Despite the United States’ increasing oil exports prior to World War II, by the early 1950s the country became a net importer due to rising motor fuel consumption and supply disruptions in several states. A notable aspect of this transition is the role of Mexico, which emerges as a pivotal trade partner for the US in this energy transition.
3. 1973–2010: the period is characterized by prevailing role of OPEC, oil supply shocks (before 2000, demand shocks prevail since the early 2000s), formation of the oil futures market.
During this period, US dependence on oil imports also increased, although governments made attempts to increase domestic production.
4. 2010–current period: the period is characterized by the growing importance of climate regulations, the shale revolution in the US, the growth of renewables consumption, and from 2022, the redominant role of geopolitical interests on energy markets. Mexico and Canada remain among the key US energy trading partners.
The energy crisis of 1973 signaled the commencement of a period in which the US endeavored to ensure its energy security. In the spring of 1973, the administration of President Richard Nixon unveiled a novel energy strategy, one that was aimed at increasing domestic production in order to reduce the country’s import dependence, as well as to address the nationwide fuel shortage. In response to the oil embargo imposed by the Organization of Arab Petroleum Exporting Countries (OAPEC) and the subsequent threefold increase in oil prices, the US Congress enacted a series of legislative acts designed to safeguard the domestic market. These acts included the Emergency Petroleum Allocation Act in 1973, the Energy Supply and Environmental Coordination Act in 1974, and the Energy Policy and Conservation Act in 1975. Notably, the latter act stipulated the establishment of a strategic petroleum reserve. Despite the initial intention of these laws to stabilize oil prices through direct regulation, they resulted in a decline of domestic production, consequently leading to a shortage in the market. Between 1974 and 1978, there was a substantial increase in crude oil imports, with a nearly twofold rise in imports and a 30% surge in domestic consumption. This period was characterized by significant price escalation, particularly against the backdrops of events in Iran, which indicates the ineffectiveness of the implemented measures.
Figure 1. US energy balance, %, 1970–2023
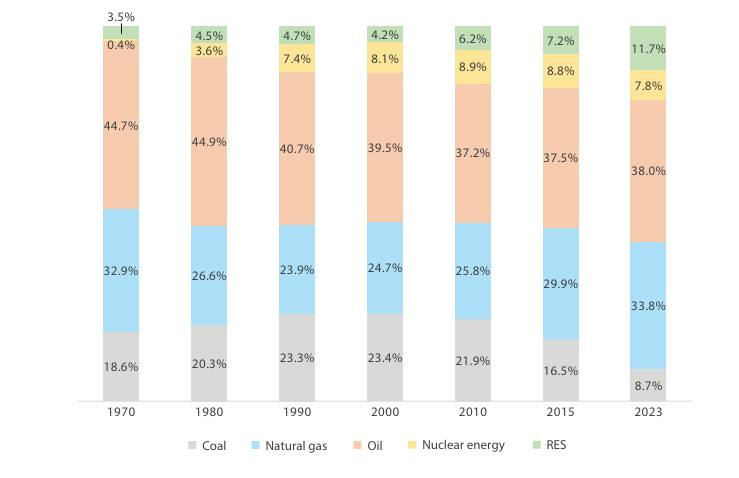
Source: Author’s calculations based on data from US Energy Information Administration (1970–2022), Energy Institute Statistical Review of World Energy (2023).
The assumption of office by Jimmy Carter and the subsequent adoption of his National Energy Act in 1978 marked the onset of a substantial restructuring of the entire industry. This transformation was precipitated by the continued rise in the cost of imported oil due to geopolitical dynamics in the Middle East. The Act placed significant emphasis on reducing energy consumption, establishing reserves, and developing alternative energy sources. In 1978, a series of five legislative acts were passed, including the National Energy Conservation Policy Act, the Power Plant and Industrial Fuel Use Act, the Public Utility Regulatory Policies Act, the Energy Tax Act, and the Natural Gas Policy Act. The latter Act marked the initial phase of deregulating gas pricing. The combination of domestic shortages and high oil prices led to accelerated growth in oil company revenues. Consequently, in 1980, an excess profits tax on crude oil sales was imposed until 1988, with the aim of offsetting the effects of deregulated oil prices. However, this measure merely served to exacerbate the nation’s reliance on imported oil, a consequence of the escalating marginal costs experienced by domestic producers, the decline in global oil prices, and the reduction of costs of upstream technologies internationally.
Figure 2. US crude oil imports, production and consumption trends, current price trends
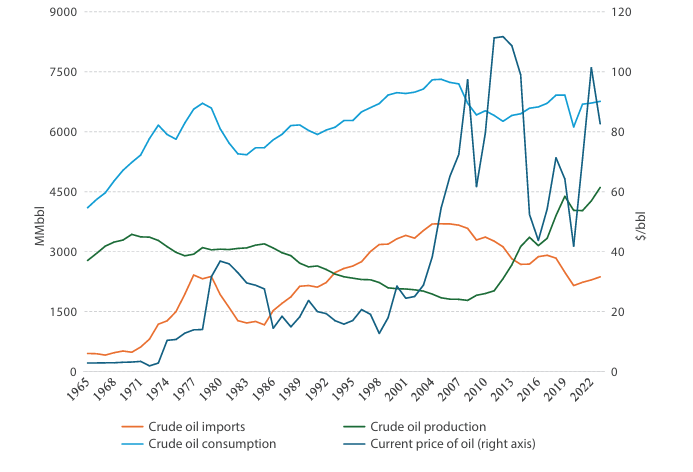
Note: Prices in the period 1965–1972 are presented for the US average; in the period 1972–1976, for Arabian Light (Ras Tanura) crude oil; in the period 1976–2023, for Brent crude oil.
Source: Author’s calculations based on data from the US Energy Information Administration, Energy Institute Statistical Review of World Energy.
The 1990s was characterized by a persistent decline in prices and domestic oil production. Notably, the year 1992 witnessed a pivotal shift with the deregulation of natural gas pipeline transportation, which entailed the unbundling of transportation, storage, and sales services. This unbundling facilitated direct contracting of supplies to buyers from the fields. In addition, for the first time, the problem of growing GHG emissions were discussed internationally. The Kyoto Protocol had been established, although it was not ratified by the US. In fact, the prerequisites for the current conflict of interest between oil and gas companies and supporters of decarbonization were starting to form.
The 21st century for the US energy sector is marked primarily by the development of offshore production technologies and, as a result, growth in upstream investment, the increasing role of climate regulation, and supply shocks in the global market. Fracking technologies have made it possible to achieve record levels of oil and gas production.
Figure 3. Imports, exports, production, consumption and current prices of natural gas in the US
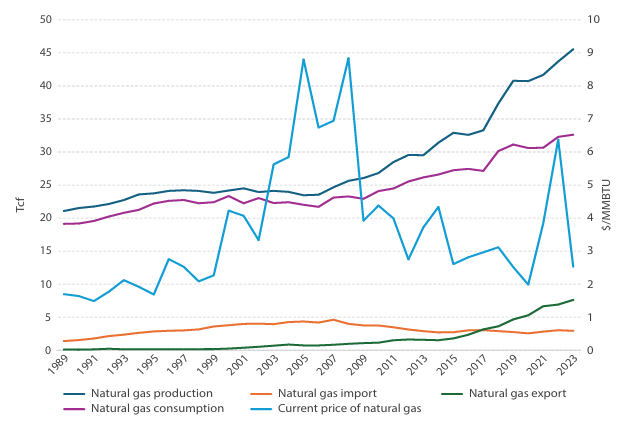
Source: Author’s calculations based on data from the US Energy Information Administration, Energy Institute Statistical Review of World Energy.
US oil upstream investments in the US until 2020 were characterized by a higher sensitivity to oil prices (see Figure 4) [EIA 2015]. The price of oil was a reflection of the current market situation, and accordingly, price increases often indicated the need to increase supply and, as a result, led to increased investment in the upstream segment. From 2003 to 2014, upstream investment tripled, reflecting not only rising oil prices but also increasing global demand and the country’s objective of achieving energy security.
Given the high price sensitivity during this period, the drop in investment in 2014 can be primarily attributed to the fall in oil prices in the second half of the year in response to the increase in shale oil production in the United States and the general slowdown in global economic activity in 2015–2016 [Stocker et al. 2018]. Investment cycles in the oil market through 2014 also provide insight into the response of upstream investment to changes in energy prices.
It should be noted that the shale revolution has resulted in a substantial reduction in the payback period of investment projects, thereby exacerbating the correlation between investments and price fluctuations. In 2024, Rystad Energy estimates the average payback period for tight oil projects at an average price of $70/bbl to be two years, while for other supply segments the payback period is closer to 10 years. The transition to “short-term” projects has also resulted in a shift of industry risks to financial market players, as projects can deliver supplies to the market almost immediately upon launch. The ramifications of this transition will become more evident after 2020, when the recovery of oil prices and demand, and consequently, the substantial increase in cash flows of oil and gas producers following the lifting of lockdown restrictions, did not result in a significant growth of upstream investments. This was attributed to the prevailing high degree of uncertainty in the market and the anticipation of oil and gas companies of elevated rates of energy transition, which consequently led to the redistribution of profits to renewable energy (RES) projects, paying out dividends, or debt repayment [Grigoryev, Kheifets 2022], accumulated since the start of the shale revolution [Fattouh, Sen 2013].
Figure 4. Upstream investment and crude oil prices, 1950–2015
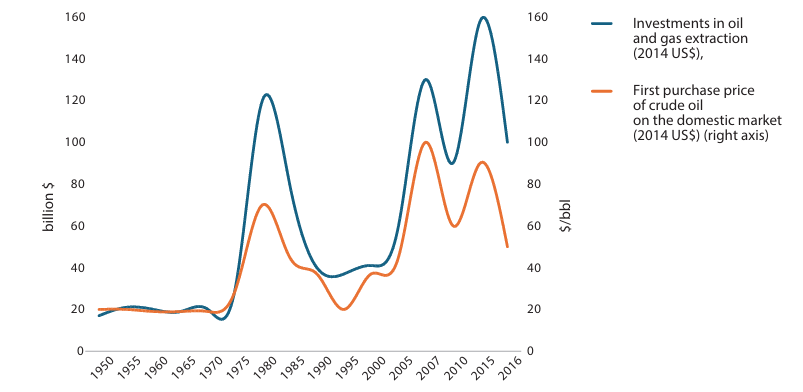
Source: US Energy Information Administration.
In 2018, investment in the upstream sector remained 40% below the 2014 level [Hacquard et al. 2019]. This decline can be attributed to several factors. Oil producers anticipated lower prices due to increasing shale oil supply, which exerted pressure on the share prices of publicly traded oil and gas companies. Consequently, companies directed their resources toward dividend payments or buybacks, while reducing upstream investments. Moreover, the proactive promotion of green energy transition policies has prompted a reallocation of capital investments by large Western oil and gas companies (e.g., BP, Total, Equinor, and Royal Dutch Shell, etc.) into renewables, along with a reduction in financing of high-risk oil and gas projects by banks. The overall slowdown in investment was also affected by the fragmentation of global trade, which led to the expectation of a slowdown in global economic growth. This has resulted in a decline in capital expenditures on exploration and maintenance of investments, with a focus on enhancing production efficiency in existing fields.
In 2020, lockdowns and the disruption of supply chains resulted in a substantial decline in oil demand, thereby precipitating a decline in investment within the industry (capital investment reached its 2006 minimum) [Grigoryev, Kheifets 2022]. According to estimates by the IEA, the decrease in investments by oil producers amounted to approximately 25% compared to the initially announced plans for 2020 [IEA 2021]. The primary factor contributing to this decline in investment expenditures was the reduction in oil industry revenues due to falling oil prices and demand, caused, among other things, by the high degree of uncertainty associated with the further spread of COVID-19. The most substantial decline in investment was observed among companies engaged in shale oil production in the US, attributable to diminished profitability (S&P estimates that only half of the wells remain profitable at $40/barrel) [S&P Global 2020] and elevated creditworthiness.
However, as of the end of 2021, investments in the industry showed signs of a recovery. OPEC+ cuts, as well as the recovery of economic activity and, as a result, oil demand, led to an increase in energy prices. In response, upstream investments in the US have increased again, although they have not returned to prepandemic levels.
Figure 5. Levels of cash flow and capital expenditures of selected 36 US publicly traded oil and gas companies, 2019–2024, $ billion (in US$ 2024)
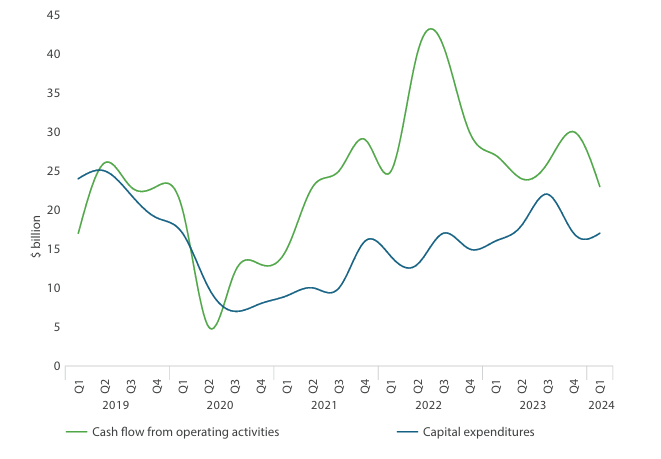
Source: US Energy Information Administration.
In the period 2022–2023, upstream investments exhibited growth, albeit at a relatively “flat” rate. Rising commodity prices, consequent to escalating geopolitical tensions, precipitated a surge in capital investment in the US, albeit with a limited temporal scope, restricted to the third quarter of 2022. Subsequent growth decelerated, attributable to elevated operating costs for enterprises (due to escalating labor costs and supply chain disruptions) and heightened tax collections. It is noteworthy that the escalation of conflicts in the Middle East in 2023–2024, while resulting in an increase in oil prices, did not contribute to the geopolitical price premium. Consequently, the impetus for increasing upstream investments in the US oil industry will not be geopolitical tensions (this will be facilitated more by regulatory relaxations of the new administration), which allows to conclude that the sensitivity of investments to prices will further decrease.
Structure of the US energy balance
The structure of the US energy balance has demonstrated relative stability over the past 50 years, with an increasing share of gas after 2014. Despite the active climate agenda both in the world and the US, especially with the President Biden administration, the share of oil and gas in the country’s energy mix still exceeds 70%.
The advent of hydraulic fracturing and horizontal drilling technologies has precipitated a paradigm shift in the global oil and gas market, resulting in substantial growth in US oil and gas production. In 2023, the United States accounted for 20% of global oil production and 25.5% of global gas production. In 2020, the US became a net exporter of oil (key export destinations are Canada, Mexico, China, and the EU), which was facilitated by both the growth of shale production and, consequently, an increase in light oil supplies to the market, as well as the lifting of the ban on oil exports in the country in 2015. However, it should be noted that the composition of US production is predominantly characterized by low-sulfur fuels. While heavy oil consumption is primarily met by stable imports from Canada and production in California, this fact does not negate the discussion of energy security within the context of novel industrial policies and multiple shocks.
Table 1. Trends in production, consumption, exports and imports of major energy sources in the US, 2019–2023
|
2019 |
2020 |
2021 |
2022 |
2023 |
Growth 2022-2023, % |
CAGR 2019-2023, % |
Growth 2019–2023, % |
|
|
Oil (MMbbl/d) |
||||||||
|
Production |
17.1 |
16.5 |
16,7 |
17,8 |
19,4 |
8% |
3% |
13% |
|
Consumption |
19.4 |
17.2 |
18,8 |
18,9 |
19,0 |
1% |
-1% |
-2% |
|
Exports |
8.0 |
8.1 |
8,0 |
8,5 |
9,1 |
7% |
3% |
14% |
|
Import |
9.1 |
7.9 |
8,5 |
8,3 |
8,5 |
2% |
-2% |
-7% |
|
Gas (Bcm) |
||||||||
|
Production |
928.1 |
924.8 |
944.5 |
993.4 |
1035.3 |
4% |
3% |
12% |
|
Consumption |
851.0 |
834.5 |
836.4 |
879.6 |
886.5 |
1% |
1% |
4% |
|
Exports |
124.8 |
140.2 |
178.8 |
187.3 |
203.4 |
9% |
13% |
63% |
|
Import |
74.7 |
69.5 |
76.5 |
82.8 |
79.5 |
-4% |
2% |
6% |
|
Coal (EJ) |
||||||||
|
Production |
14.3 |
107 |
11.6 |
12.1 |
11.8 |
-2% |
-5% |
-17% |
|
Consumption |
11.3 |
9.2 |
10.6 |
9.9 |
8.2 |
-17% |
-8% |
-28% |
|
Exports |
2.2 |
1.7 |
2.2 |
2.2 |
2.5 |
11% |
3% |
12% |
|
Import |
0.2 |
0.6 |
0.1 |
0.2 |
0.1 |
-35% |
-10% |
-36% |
|
Renewables (quadrillion BTU) |
||||||||
|
Production |
7.8 |
7.5 |
7.8 |
8.3 |
8.4 |
1% |
2% |
9% |
|
Consumption |
7.6 |
7.3 |
7.6 |
8.1 |
8.2 |
2% |
2% |
9% |
|
Nuclear Power (EJ) |
||||||||
|
Production |
3.1 |
3.0 |
3.0 |
2.9 |
2.9 |
1% |
-1% |
-4% |
|
Consumption1 |
7.8 |
7.5 |
7.4 |
7.3 |
7.3 |
0,1% |
-1% |
-6% |
Source: Energy Institute Statistical Review of World Energy, US Energy Information Administration.
Achieving energy security has been a priority for the United States since the mid-20th century, when the country became a net importer of energy. Despite the persistent endeavor to increase domestic production, US imports showed steady growth, reaching a peak only in 2006. Over the past 50 years, the structure of US imports has also been significantly transformed. Thus, the share of OPEC countries, which accounted for almost half of all US imports in the last century (47% in 1973), decreased to 16% in 2023. Today, Canada, Mexico, Saudi Arabia and Nigeria traditionally stand out among the key oil suppliers to the US (see Table 2).
Table 2. Geographic structure of oil imports to the United States, 1973–2023, MMbbl/d
|
1973 |
2000 |
2010 |
2015 |
2019 |
2022 |
2023 |
|
|
Non-OPEC |
3.3 |
6.3 |
6.9 |
6.6 |
7.5 |
7.1 |
7.2 |
|
Canada |
3.0 |
1.8 |
2.5 |
3.8 |
4.4 |
4.4 |
4.4 |
|
Mexico |
0.0 |
1.4 |
1.3 |
0.8 |
0.7 |
0.8 |
0.9 |
|
Russia |
0.0 |
0.0 |
0.6 |
0.4 |
0.5 |
0.1 |
0 |
|
OPEC |
3.0 |
5.2 |
4.9 |
2.9 |
1.6 |
1.3 |
1.3 |
|
Saudi Arabia |
0.5 |
1.8 |
1.1 |
1.1 |
0.5 |
0.6 |
0.4 |
|
Nigeria |
0.5 |
0.9 |
1.0 |
0.1 |
0.2 |
0.1 |
0.2 |
|
Iraq |
0.0 |
0.6 |
0.4 |
0.2 |
0.3 |
0.3 |
0.3 |
|
Venezuela |
1.3 |
1.5 |
1.0 |
0.8 |
0.1 |
- |
0.1 |
|
Total |
6.3 |
11.5 |
11.8 |
9.4 |
9.1 |
8.3 |
8.5 |
Source: US Energy Information Administration.
In addition to a significant change in the composition of US oil imports in 2022, it should be noted that the rebalancing of exports, which was influenced by numerous factors: bilateral economic sanctions against Russia, an increased demand for oil in China after lockdowns, and OPEC+ cuts. The imposed sanctions against Russia resulted in a substantial price surge in 2022 and a profound restructuring of the entire market. The imposed oil price caps have necessitated the EU to look for new energy suppliers, primarily in the Middle East and the US (Table 3). Consequently, exports of crude oil and petroleum products from the US to the EU (including the UK) have increased by more than 60% in 2023 compared to pre-2019 levels.
Table 3. Geographic structure of US oil exports, 2000–2023, MMbbl/d
|
2000 |
2010 |
2015 |
2019 |
2022 |
2023 |
|
|
Canada |
0.1 |
0.2 |
1.0 |
1.0 |
0.8 |
0.9 |
|
Mexico |
0.4 |
0.4 |
0.7 |
1.2 |
1.2 |
1.2 |
|
China |
0.0 |
0.1 |
0.2 |
0.2 |
0.6 |
1.0 |
|
European Union, including UK |
0.2 |
0.4 |
0.7 |
1.5 |
2.2 |
2.6 |
|
Republic of Korea |
0.0 |
0.0 |
0.1 |
0.6 |
0.6 |
0.6 |
|
Japan |
0.1 |
0.1 |
0.2 |
0.6 |
0.5 |
0.6 |
|
India |
0.0 |
0.0 |
0.1 |
0.5 |
0.5 |
0.4 |
|
Singapore |
0.0 |
0.1 |
0.1 |
0.1 |
0.4 |
0.4 |
|
Total |
1.0 |
2.4 |
4.7 |
8.5 |
9.5 |
10.2 |
Source: US Energy Information Administration.
As with oil, US natural gas production has increased significantly over the past decade (see Table 4). The country is now a net exporter due to the development of LNG terminals. It is anticipated that LNG exports will continue to expand, driven by increased global demand and Donald Trump’s initiatives to enhance the nation’s presence in the global LNG market and launch new terminals.
According to the International Gas Union, the US overtook Australia and Qatar to become the world’s leading LNG producer in 2023. The US Energy Information Administration has reported that the US also set a record in 2023, exporting 10% more natural gas than it did in 2022, reaching 20.9 Bcf/d. LNG exports accounted for more than half of the total, while the remainder was supplied via pipelines to Canada and Mexico. In 2023, the US accounted for nearly half of Europe’s LNG imports, inter alia in response to the imposed sanctions against Russia. The other primary supply destinations were Mexico and the Asia-Pacific region, led by South Korea and Japan.
Table 4. Geographic structure of gas exports from the US, 2000–2023, Bcm
|
2000 |
2010 |
2015 |
2019 |
2022 |
2023 |
|
|
Canada |
0.0 |
0.0 |
0.5 |
51.5 |
109.5 |
123.0 |
|
Mexico |
0.0 |
0.0 |
0.5 |
51.5 |
109.4 |
123.0 |
|
Argentina |
0.0 |
0.0 |
0.0 |
3.3 |
16.2 |
14.0 |
|
Bangladesh |
1.9 |
0.9 |
0.2 |
5.7 |
5.9 |
8.8 |
|
China |
0.0 |
0.0 |
0.0 |
0.2 |
2.7 |
4.9 |
|
India |
0.0 |
0.0 |
0.0 |
0.1 |
2.2 |
1.6 |
|
European Union, including UK |
0.0 |
0.0 |
0.0 |
13.7 |
24.4 |
22.4 |
|
LNG |
5.0 |
30.4 |
49.7 |
80.4 |
86.1 |
92.5 |
|
Pipeline gas |
1.9 |
1.8 |
0.8 |
51.5 |
109.5 |
123.0 |
|
Total |
6.9 |
32.2 |
50.5 |
131.9 |
195.6 |
215.5 |
Source: US Energy Information Administration.
Table 5. Geographic structure of US gas imports, 1973–2023, Tcf
|
1973 |
2000 |
2010 |
2015 |
2019 |
2022 |
2023 |
|
|
Canada |
29.1 |
100.4 |
92.9 |
74.3 |
76.1 |
84.9 |
82.4 |
|
Trinidad and Tobago |
0.0 |
2.8 |
5.4 |
2.0 |
1.3 |
0.7 |
0.3 |
|
LNG |
0.0 |
6.4 |
12.2 |
2.6 |
1.5 |
0.7 |
0.4 |
|
Pipeline gas |
0.0 |
100.7 |
93.7 |
74.4 |
76.1 |
84.9 |
82.5 |
|
Total |
29.2 |
107.1 |
105.9 |
77.0 |
77.6 |
85.6 |
82.9 |
Source: US Energy Information Administration.
Impact of the new energy policy on the US energy sector
The demand for primary energy in the United States is projected to undergo significant sectoral changes in the coming decades, largely influenced by several key trends. These include the reorganization of industrial production both domestically and globally, expanded investment and data centers load growth (according to Goldman Sachs, the share of data centers in total energy consumption will increase from 3% in 2022 to 8% in 2030 [Goldman Sachs 2024]) as well as large-scale electrification.
According to Deloitte, the demand for electricity in the US is projected to nearly triple over the coming decades, driven by the electrification of transport, residential, and industrial sectors [Deloitte 2023]. Through the year 2030, electrification of heating and transportation will be a significant driver of demand growth, especially in the northeastern and western states. In regard to electric vehicles, the anticipated growth in sales is a key factor, complemented by the gradual decline in their cost relative to internal combustion engine vehicles, which is expected to stimulate demand for electricity. Conversely, the demand for gasoline may witness a decline, though the impact of electrification in this regard is expected to be less pronounced.
Figure 6. US primary energy consumption by sector, %,
inner circle is 2000, middle circle is 2015, outer circle is 2023
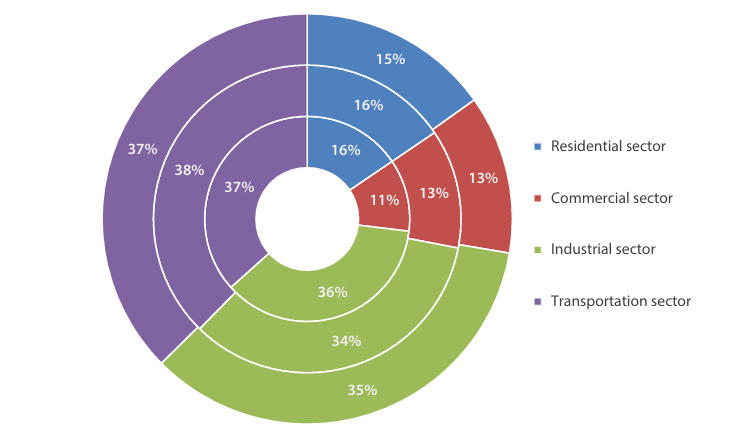
Source: US Energy Information Administration.
The US government is currently implementing financial incentives for energy transition development that are considered to be historic. These incentives are part of a series of bills, including the Bipartisan Infrastructure Act (BIL), the Inflation Reduction Act (IRA), and the Chips and Science Act. The IEA estimates that by 2030, the IRA and BIL will significantly reduce GHG emissions by 40%, meeting the country’s climate goals while also significantly lowering net oil imports and producing significant reductions in electricity costs [IEA 2024]. In the energy sector, the United States has pledged to producing 100% carbon-free electricity by 2035. In the industrial sector, the country aims to reduce CO2 emissions by 15% from 2015 levels, which account for 30% of total energy-related CO2 emissions, according to the 2030 Industrial Decarbonization Plan. In the transportation industry, the United States has implemented strong fuel economy rules and is encouraging investment in a variety of green vehicles. The federal government aims to achieve zero emissions in 50% of new passenger car and light truck sales by 2030. In the construction sector, the decarbonization strategy for buildings intends to reduce emissions by 65% by 2035 and 90% by 2050 as compared to 2005 levels. The BIL program has budgeted $550 billion to the development of renewable energy and infrastructure, while the IRA has invested approximately $370 billion to increase energy security and tackle climate change.
Contrary to the IEA’s estimates, the United States Energy Information Administration has given less optimistic forecasts for transportation electrification and decarbonization. The most recent EIA Annual Energy Outlook 2023 predicts a 25–38% reduction in emissions by 2030 compared to 2005 levels. The agency predicts an increase in electric car sales due to preferential credits under IRA but claims that these vehicles will not significantly reduce the market share of other motor vehicle manufacturers. It is crucial to emphasize that while the United States has showed progress in decreasing emissions in recent years, this progress has been limited [Esayan 2024], complicating the projection of the achievement of ambitious IRA targets.
For the past three decades, coal and gas have been the predominant sources of electricity generation in the United States. Over the past decade, domestic electricity prices have remained relatively stable (at 10 cents per kWh), reflecting progress in both energy self-sufficiency and energy efficiency. However, the historically robust electricity generation market, and more specifically, domestic consumption prices, are currently under pressure due to a number of factors: high expectations of near-term demand growth, aging generation and transmission infrastructure coupled with stagnant nuclear generation and volatility in gas markets.
Figure 7. Dynamics of natural gas and electricity prices, 2019–2024

Source: US Energy Information Administration.
It is worth mentioning that the rise in gas prices in 2022 resulted in an increase, but not in the anchoring of high domestic electricity prices. Unlike the EU, where anti-Russian sanctions resulted in a considerable increase in domestic gas and energy prices, the United States profited from lower economic costs and incentives to relocate businesses from Europe. In contrast, domestic retail and wholesale gas prices in the EU in 2023 were three to five times higher than those in the US (prices in the EU exceeded US prices “only” two to three times prior to the sanctions), and electricity prices in the EU were two to three times higher than those in China and the US (prices in the EU were on par with China prior to the sanctions and exceeded the US by 80%) [Draghi 2024].
In the case of the US, it would be more accurate to say that the root cause of electricity price growth will be the expansion of domestic demand under existing infrastructure constraints, rather than external shocks in the global gas market. According to Goldman Sachs, the anticipated surge in US electricity demand, in conjunction with the scheduled decommissioning of coal-fired power plants, will necessitate an investment of $665 billion by the year 2030. This substantial investment is projected to extend through the year 2030 [Goldman Sachs 2024]. Moreover, the electrification process necessitates an expansion in investment in gas infrastructure for domestic consumption.
The US domestic gas market has undergone a substantial transformation since the beginning of the 21st century. The increase in shale production has led to a significant drop in domestic prices, as the market's growing needs have been met by its own capacity. In the near future, the planned expansion of LNG export capacity is expected to be a primary factor influencing the dynamics of domestic gas prices in the US. The EIA anticipates that US LNG export capacity will double by 2028 compared to the 2024 figure [EIA 2024]. The resumption of pipeline infrastructure projects, several of which were terminated during the previous administration, is anticipated to occur in 2025 under the current administration. Geopolitical dynamics, such as the escalation of tensions in the Middle East and the impending expiration of the agreement for the transit of Russian gas to Europe at the end of 2024, are also likely to exert significant influence.
It is also noteworthy that in 2024, the energy sector emerged as one of the most productive in the entire US economy [Bloomberg 2024]. The past decade and a half have seen a significant surge in the US oil and gas industry, with notable ramifications. First, it has contributed to the nation’s outpacing economic growth, accompanied by substantial investment spillovers from Europe, affordable labor, and noteworthy R&D expenditures [Grigoryev 2024]. Second, it has contributed to a cumulative increase in the economy’s productivity, thereby sustaining high labor demand, following a protracted period of slow growth due to the necessity to identify more efficient solutions to augment revenues in the face of declining oil prices. Third, declining energy production costs has enabled stable electricity prices for major consumers, thereby supporting the new industrial policy. The evident success in enhancing efficiency, notably through the integration of AI, has led to a substantial growth in oil and gas majors’ earnings. The return of investors to the industry, driven by rising dividend payments during the post-pandemic price recovery, has further contributed to this growth. Additionally, significant progress has been made in enhancing energy security. Consequently, it appears implausible to conclude that the United States’ climate ambitions can be achieved.
Conclusion
The past century of development in the US energy sector has been marked by significant changes, both in terms of fuel consumption patterns and the nation’s position in the global energy market. The government was compelled to assume the primary responsibility of ensuring energy security due to supply disruptions in the 20th century oil market. After a series of laws intended to protect the domestic market that met with limited success, a technological advancement in shale production in the 21st century led to the realization of this objective.
The US energy policy is based primarily on ensuring the interests of companies, which, obviously, has led in the last decade to the conclusion that it is necessary to maintain a delicate balance between the climate lobby (and its promises of energy transition, which is becoming less achievable every year) and the revenues of the oil and gas sector. As a result, the picture of the US energy sector in 2024 is one of relatively weak emissions reductions, flat growth in upstream investments, and rising corporate revenues, which have been driven by a geopolitical premium in energy and logistics prices and increased productivity over the past two years.
Bibliography
Bloomberg, 2024. Oil Was Written Off. Now It’s the Most Productive US Industry. Available at: https://www.bloomberg.com/news/features/2024-10-31/why-oil-is-outpacing-tech-as-the-most-productive-us-industry?srnd=phx-markets
Deloitte, 2023. 2024 power and utilities industry outlook. Available at: https://www2.deloitte.com/us/en/insights/industry/power-and-utilities/power-and-utilities-industry-outlook.html
Draghi, M., 2024. The Future of European Competitiveness Part B: In-depth Analysis and Recommendations. European Commission. Available at: https://coilink.org/20.500.12592/9y7v1o8
EIA, 2015. Sustained low oil prices could reduce exploration and production investment. Available at: https://www.eia.gov/todayinenergy/detail.php?id=23072
EIA, 2024a. Decline in natural gas price drove decrease in US oil producer revenue in early 2024. Available at https://www.eia.gov/todayinenergy/detail.php?id=63204
EIA, 2024b. North America’s LNG export capacity is on track to more than double by 2028. Available at: https://www.eia.gov/todayinenergy/detail.php?id=62984
EIA. EIA database. Available at: https://www.eia.gov/opendata/
Energy Institute, 2024. Energy Institute Statistical Review of World Energy. Available at: https://www.energyinst.org/statistical-review/resources-and-data-downloads
Erlingsen, E., Busby, E., 2024. “Shale project economics still reign supreme as the cost of new oil production rises further. Rystad Energy.” Available at: https://www.rystadenergy.com/news/upstream-breakeven-shale-oil-inflation
Esayan, M.A., 2024. US Emissions and Climate Policy: National and State Trends. Contemporary World Economy, Vol. 2, No 3.
Fattouh, B., Sen, A., 2013. The US Tight Oil Revolution in a Global Perspective. Oxford Energy Comments. September 2013. Available at: https://www.oxfordenergy.org/wpcms/wp-content/uploads/2013/09/Tight-Oil.pdf
Goldman Sachs, 2024. AI, data centers and the coming US power demand surge. Available at: https://www.goldmansachs.com/pdfs/insights/pages/generational-growth-ai-data-centers-and-the-coming-us-power-surge/report.pdf
Grigoryev, L.M., 2024. Key Issues in the Long-Term Growth of the US Economy. Contemporary World Economy, Vol. 2, No 3.
Grigoryev, L.M., Kheifets, E.A., 2022. Oil market: Conflict between recovery and energy transition. Voprosy Ekonomiki, No 9. P. 5–33. Available at: https://doi.org/10.32609/0042-8736-2022-9-5-33
Hacquard, P., Simoën, M., Hache, E., 2019. Is the oil industry able to support a world that consumes 105 million barrels of oil per day in 2025? Oil & Gas Science and Technology, No 88. Available at: https://doi.org/10.2516/ogst/2019061
IEA, 2021. World Energy Investment 2020. Available at: https://iea.blob.core.windows.net/assets/ef8ffa01-9958-49f5-9b3b-7842e30f6177/WEI2020.pdf
IEA, 2024. United States 2024 Energy Policy Review. Available at: https://iea.blob.core.windows.net/assets/b5826832-7182-4abe-9041-01c9f000d69d/UnitedStates2024.pdf
OPEC, 2024. World Oil Outlook 2050. Vienna. Available at: https://publications.opec.org/woo/Home
Rubio-Vars, M., 2006. The Role of Mexico in the First World Oil Shortage: 1918–1922, an International Perspective. Journal of Iberian and Latin American Economic History, No 24(01). P. 69–95. Available at: https://doi.org/10.1017/S0212610900000471
S&P Global, 2020. Half of producing shale oil wells are profitable at $40/bbl, analyst says. Available at: https://www.spglobal.com/marketintelligence/en/news-insights/latest-news-headlines/half-of-producing-shale-oil-wells-are-profitable-at-40-bbl-analyst-says-60035427
Stocker, M., Baffes, J., Vorisek, D., 2018. What triggered the oil price plunge of 2014–2016 and why it failed to deliver an economic impetus in eight charts. In: Global Economic Prospects: Broad-Based Upturn, but for How Long? World Bank. Available at: https://doi.org/10.1596/978-1-4648-1163-0
Notes
1 Calculation based on gross generation excluding cross-border electricity supply. Energy volume is calculated on a cost-equivalent basis.

1.jpg)
