
The International Investment Position of the United States in the Twenty-First Century
[Чтобы прочитать русскую версию статьи, выберите русский в языковом меню сайта.]
Dzhanneta Medzhidova – PhD, Senior Advisor to the Executive Director, World Bank Group.
ORCID: 0000-0003-1063-3162
For citation: Medzhidova, D., 2024. The International Investment Position of the United States in the Twenty-First Century. Contemporary World Economy, Vol. 2, No 3.
Keywords: international investment position, United States, direct investment, portfolio investment, capital flows.
The views expressed in this publication are solely those of the author. It does not purport to reflect the views or opinions of the World Bank Group or its members.
Abstract
The accumulation process in the United States is contingent upon the substantial opportunities presented by domestic corporations, encompassing amortization and retained earnings, in addition to both internal and external sources of financing. The present study is dedicated to the analysis of the evolution of the international investment position of the United States since the beginning of the 21st century. The objective of the present study is to identify changes in the structure of US liabilities and assets during three key periods: 2000–2007, 2007–2019, 2019–2023 in the context of global processes and the country’s monetary policy. During the period spanning from 2000 to 2023, net investment inflows amounted to nearly $20 trillion at “moderate market prices,” discounted for stability and security. Concurrently, financial investment in the US economy is predominantly concentrated in the forms of equity, investment funds, and long-term debt. An analysis of the geographical distribution of US portfolio investments reveals the stability of the nation’s primary partners, with developed countries and offshore financial centers predominating. However, during the period under review, there were changes in financial flows between the US and developing countries, primarily the BRICS countries.
US international investment position
The evolution of the US financial system, its enormous size and wide international presence of US companies and financial institutions, as well as the specificity of the dollar position, make it a huge platform for financial intermediation. Financial institutions in the United States, including banks and funds, facilitate a vast array of transactions and contracts of varying durations and volumes. These financial intermediaries play a pivotal role in facilitating the transfer of savings from domestic economic agents (i.e., families, firms, and various levels of government) to international capital flows, i.e., integration into the global economy. Capital movement constitutes the most significant component of globalization processes. The nature of international intermediation is contingent upon the specifics of a nation’s developmental stage and the state of the financial market.
The International Investment Position (IIP) serves as an integral indicator, capturing the cumulative outcome of decades of cross-border capital movements involving the United States. The significance of this indicator stems from its role in globalization within the financial sector. Concurrently, it underscores the interplay between the persistent US trade deficit and countervailing factors within the financial balance. In the context of the United States, as the largest developed economy, this indicator functions as an accumulated index, unveiling the dynamics of financial interdependency among nations and the instruments employed in these transactions. The necessity for the formulation of an IIP theory is largely obviated by the existence of a robust body of traditional theories that adequately address the dynamics of exports and imports of capital in various forms, instruments, and geographies. However, the combination of factors over time is a more complex matter, as it can involve numerous variants. It is crucial to acknowledge that for any nation, particularly the US, the combination of factors is distinct for both exports and imports. A comprehensive analysis of the United States’ development and monetary policy is inherently incomplete without considering capital flows and the nation’s international investment position.
The overall tendency of the US IIP is evident, marked by an expansion of the disparity between assets and liabilities, with the latter exhibiting an upward trend. Consequently, by the close of 2023, the nation’s international investment position had reached $19.8 trillion. This figure signifies a substantial increase of nearly $17.5 trillion when compared to the 2002 levels (refer to Figure 1). It is important to note that this trend was not linear; for instance, following a substantial increase in 2008, the deficit experienced a slight contraction in 2009–2010, yet it failed to revert to its pre-crisis level. A more substantial reduction in the disparity between assets and liabilities was observed in 2022. Consequently, the United States maintains its status as a “safe haven,” ensuring the security and protection of investments for its global investors.
The net international investment position (IIP) is defined as the value of accumulated US financial assets held by foreign residents, minus US liabilities held by foreign residents. Specifically, assets signify investments made by US residents in foreign markets, while liabilities denote investments made by foreign residents in the US economy.
A negative IIP signifies net financial inflows through direct and portfolio investment in the US economy.
It is imperative to note that both direct and portfolio investments are encompassed within each category. Direct investment entails a substantial degree of participation (or control) by residents of one country in an enterprise or company in another country. In contrast, portfolio investments do not entail substantial ownership or control.
Portfolio investments encompass a broad spectrum of financial instruments, including debt instruments such as US Treasury securities, which are classified as liabilities, as well as equity and investment funds. Direct investments encompass investments in equity and debt instruments.
Figure 1. US international investment position, year-end assets and liabilities, US$ trillion
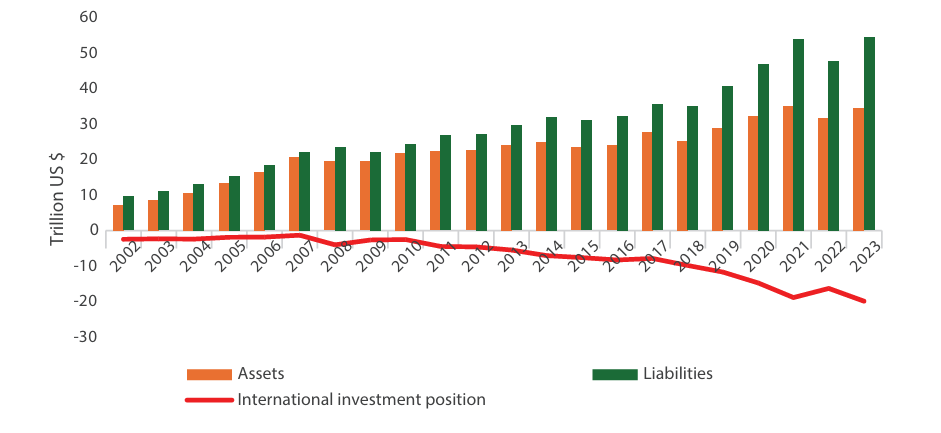
Source: compiled by the author on the basis of data from the US Bureau of Economic Analysis.
The international investment position of the United States has historically been indicative of the accumulation of external assets in developing countries (primarily in China and oil-exporting countries) and the parallel investment of these savings in the US economy [Summers 2006]. Data analysis lends support to this thesis. The increase in capital inflows (liabilities’, as defined in the IIP framework) throughout the period (2000–2023) was driven by direct and portfolio investments in private business assets, as well as portfolio investments in debt securities, primarily long-term (debt bonds of the US Department of the Treasury and other securities).
J. Perelstein emphasizes that the deficit of the balance of payments and foreign trade emerged as a contributing factor to the global financial crisis, thereby establishing the preconditions for the growth of income in developing countries. This, in turn, prompted investors to seek “risk-free” assets to invest in the US economy [Perelstein 2009]. Bernanke and colleagues propose the concept of “global excess savings,” which they theorize as the primary catalyst for capital outflows from developing countries to developed countries in the pre-crisis period. This phenomenon is described as having contributed to the decline in long-term interest rates within the United States [Bernanke et al. 2011]. O. Blanchard’s work focuses on “global imbalances” within the financial system, which were exacerbated by the global financial crisis. These imbalances encompass the US’s current account deficit, the substantial demand for US assets, and the significant savings in China and oil-exporting countries. The factors determining the imbalances of the global financial system are in a state of constant flux, as is the geography of capital flows [Blanchard, Milesi-Ferretti 2009]. For the period spanning from 2000 to 2023, the United States’ accumulated net savings amounted to approximately $8 trillion.1 In contrast, capital inflows during the same period exceeded $18 trillion, a figure that surpasses the accumulated defense expenditure of $17 trillion [Blanchard, Milesi-Ferretti 2009].
Notably, the disparity between assets and liabilities has increased in favor of the latter, both in absolute values and in the ratio to real GDP. Figure 2 illustrates the annual fluctuations (in percentage of GDP) of several pivotal indicators. The annual increase in public debt, which peaked at 14.6% of GDP in 2021, is indicative of a growing financial burden. The trade account balance has been consistently negative between 2000 and 2023, ranging from -2.5% to -5.5% of GDP. The IIP shows pronounced volatility, with negative spikes during the crisis years such as 2008 and 2021 (despite a GDP gain in 2021) and positive peaks in 2009 and 2022 (followed by declines).
The historical development of the US IIP during the 21st century is clearly shown in Figure 2. The analysis reveals a consistent trend of stronger growth in foreign investments in the United States compared to foreign assets of American economic agents, with only two significant interruptions (2009 and 2022) that led to a substantial decrease in “capital immigration” to the country. The negative trade balance was naturally covered by capital inflows, especially given the stable dollar. The growth of public debt also played a significant role in absorbing global excess savings, particularly from developed countries, China, and oil exporters, although available statistics obscure the sources of funds (for example, the Cayman Islands account for approximately one-fifth of portfolio investments).
Figure 2. Annual change in the balance of foreign trade, public debt and US IIP2 2000–2023, in % of nominal GDP
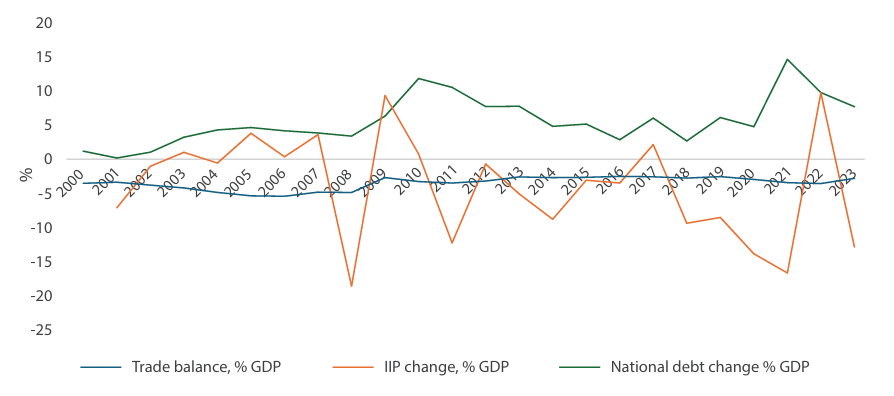
Source: compiled by the author on the basis of BEA and FRED data.
Rooted in profit maximization and business expansion, the American entrepreneurial tradition, manifested in the relocation of businesses to Europe, Latin America, and the rest of the world in the post-World War II era. In accordance with this phenomenon, the hypothesis that has been substantiated by empirical evidence suggests the exportation of financial resources in the form of capital. This exportation confers a degree of direct control over operations, thereby elevating the stock prices of parent companies and generating dividends. The increase in US assets abroad can be attributed, to a significant extent, to the growth in direct capital investment (see Table 1). In 2023, equity investments constituted approximately two-thirds of US assets. The study utilizes current prices, as they more accurately reflect the market value of assets and liabilities, including price fluctuations in financial markets and changes in exchange rates. However, it is crucial to note that during the specified period, assets rose from 0.07% of GDP (at current prices) in 2000 to 0.13% of GDP in 2023, while liabilities grew from 0.09% of GDP to 0.2% of GDP, and IIP increased from 0.01% of GDP to 0.07% of GDP.
The volume of capital investments has also increased in IIP liabilities, but the total share of direct and portfolio investments is smaller, at 51%. Although the volume of investments in US debt instruments shifted, the composition of liabilities has remained broadly stable: in 2000, debt instruments constituted 33% ($3 trillion), while in 2023, this share stands at 29% ($15.7 trillion). Investing in US government, municipal, and corporate bonds can be strongly associated with the safety of holding capital, and in this sense, low risks can draw relatively cheap debt financing into the country over the long term. The sustained inflow of investment in US debt instruments reflects their favourable risk-return profile, the prevalence of global excess savings (fast-growing developing countries, Gulf countries), a well-developed financial system, and the stability of the US economy [Jackson 2013].
Table 1. Critical items in the US international investment position, year-end assets and liabilities, trillion dollars, 2000-2023
|
2000 |
2007 |
2010 |
2019 |
2023 |
The difference, 2000-2023 |
|
|
Assets (of US agents abroad) |
7.6 |
20.7 |
21.8 |
28.8 |
34.4 |
+26.8 |
|
Direct investment in equity |
2.5 |
5.1 |
4.6 |
7.5 |
9.3 |
6.7 |
|
Portfolio investments in equity and investment funds |
1.9 |
5.2 |
4.9 |
9.5 |
11.5 |
9.6 |
|
Direct investments in debt instruments |
0.4 |
0.8 |
0.9 |
1.2 |
1.3 |
0.9 |
|
Portfolio investments in debt securities, including: |
0.7 |
2.0 |
2.3 |
3.6 |
3.9 |
3.1 |
|
Short-term |
0.1 |
0.4 |
0.5 |
0.5 |
0.4 |
0.3 |
|
Long-term |
0.6 |
1.6 |
1.8 |
3.1 |
3.4 |
2.8 |
|
Liabilities (foreign assets in the US) |
9.2 |
22.0 |
24.3 |
40.5 |
54.3 |
+45.1 |
|
Direct investment in equity |
2.4 |
3.1 |
2.9 |
8.8 |
13.0 |
10.5 |
|
Portfolio investments in equity and investment funds |
1.6 |
3.2 |
3.5 |
9.3 |
14.7 |
13.1 |
|
Direct investments in debt instruments |
0.6 |
1.0 |
1.2 |
1.7 |
1.8 |
1.3 |
|
Portfolio investments in debt securities, including: |
2.4 |
7.1 |
8.3 |
12.5 |
13.9 |
11.5 |
|
Short-term |
0.3 |
0.8 |
0.9 |
0.9 |
1.3 |
1.0 |
|
Long-term |
2.0 |
6.3 |
7.4 |
11.5 |
12.6 |
10.5 |
|
Assets-liabilities, difference |
-1.5 |
-1.3 |
-2.5 |
-11.7 |
-19.9 |
-18.33 |
|
Direct investment in capital |
0.1 |
2.0 |
1.7 |
-1.3 |
-3.7 |
-3.8 |
|
Portfolio investments in equity and investment funds |
0.2 |
2.0 |
1.4 |
0.2 |
-3.3 |
-3.5 |
|
Direct investments in debt instruments |
-0.2 |
-0.3 |
-0.3 |
-0.5 |
-0.5 |
-0.3 |
|
Portfolio investments in debt securities, including: |
-1.7 |
-5.1 |
-6.1 |
-8.8 |
-10.0 |
-8.4 |
|
Short-term |
-0.2 |
-0.4 |
-0.4 |
-0.4 |
-0.9 |
-0.7 |
|
Long-term |
-1.5 |
-4.7 |
-5.6 |
-8.4 |
-9.2 |
-7.7 |
Source: US Bureau of Economic Analysis.
The transportation infrastructure of the United States was developed with European financial assistance during the nineteenth century [Grigoryev and Morozkina 2021]. However, during the twentieth century—particularly in the context of the First and Second World Wars—the United States assumed the role of a creditor to the rest of the world [Lipsey 1977]. The American economy transitioned from a role as a “world creditor” to a “world borrower” as early as in the 1990s. The impetus for this shift stemmed from the heightened demand from international investors for US debt bonds and assets. These assets were secured by the United States’ reliability, safety, and high returns, a factor that was previously discussed. This was facilitated by the development of the financial market [Aliber 2020]. Concurrently, a notable characteristic of the United States’ international investment position, in comparison to that of other developed countries, was the substantial presence of debt bonds within its liabilities [Swiston 2005].
This study focuses on three significant periods to analyze shifts in the US investment position: 2000–2007, 2007–2019, and 2019–2023. To this end, we will consider several categories of financial instruments: direct investment in equity, portfolio investment in equity and investment funds, and direct and portfolio investment in debt instruments (short-term and long-term).
Figure 3 provides a timeline of the US economy from 2000 to 2023, taking into account the three recessions that have occurred: (1) a small recession in 2001 associated with the dot-com crisis, (2) the 2007–2009 recession associated with the mortgage and subsequently global financial crisis, and (3) the recession associated with the 2020 pandemic-induced crisis.
Figure 3. Real GDP growth, %, Federal Funds Effective Rate, %, Yield of 10-year US Treasury bonds, %, quarters, 2000–2023
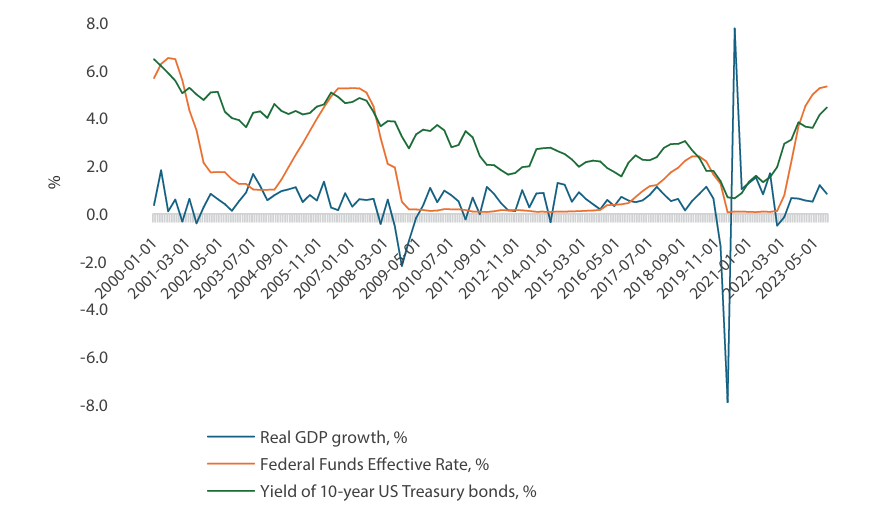
Source: compiled by the author according to FRED data.
In the first period analyzed, the US international investment position improved, with the difference between assets and liabilities narrowing by $0.3 trillion.
Assets. The share of direct equity investments in assets declined, while portfolio investments in equity and investment funds increased. A similar trend was observed in US direct investment in debt instruments, which experienced a decline, while portfolio investment in long-term financial instruments witnessed an increase. Asset reallocation was primarily driven by dollar appreciation and the subsequent reevaluation of US investors’ foreign holdings [Higgins, Klitgaard, and Tille 2006].
Liabilities. Direct investments in capital also underwent a substantial decline in the structure of liabilities, while the share of debt securities increased by a comparable amount, becoming the most prominent financial instrument in US liabilities. The predominant factor propelling this shift was the advantageous macroeconomic environment. Despite the repercussions of the dot-com crisis, the economy exhibited sustained growth, inflation remained manageable, and the Federal Reserve maintained a relatively high key rate. This configuration fostered high returns on long-term US bonds, relative to other periods, thereby stimulating capital inflows into debt securities.
Notably, the 2001 crisis did not impede the economic growth, as evidenced by the sustained average annual GDP growth of 2.5% during this period. During this period, the US economy benefited significantly from globalization and the development of financial markets, as evidenced by the substantial growth in derivatives, the volume of investments in which returned to the level of 2000 already after the financial crisis. During the period from 2000 to 2007, the United States experienced a significant imbalance in its trade balances with China, leading to substantial flows of funds from oil exporters. Concurrently, a substantial “flight to American assets” occurred, accompanied by the export of capital, particularly direct and portfolio equity. It is noteworthy that the growth of US assets during the period 2000–2007 is comparable to that of the subsequent period (2007–2023), with respective values of $13.1 trillion and $13.7 trillion. Concurrently, the growth of investments in the US economy (liabilities) exhibited a comparable trajectory.
During the second period (2007–2019), structural shifts in assets continued: a gradual decrease in the share of direct investments in equity against the background of an increase in the share of portfolio investments in long-term debt securities. In addition, the share of portfolio investments in short-term debt financial instruments increased.
The liability structure mirrored earlier patterns observed in 2000, with an increase in the proportion of portfolio investments in equity and investment funds (although this dynamic was not stable, as the proportion decreased even after 2010), and a slight decrease in the share of long-term debt securities. Concurrently, direct capital investments in the US exhibited an uptick. However, the gap between liabilities and assets widened, reaching $11.7 trillion by 2019, although it had narrowed three times over the period—in 2007, 2010, and 2017.
Changes in the composition of US assets and liabilities were largely shaped by the prevailing macroeconomic conditions both domestically and globally. For instance, following the global financial crisis, it took several years to restore investor confidence in equities, which contributed to the growth of investments in debt instruments and investment funds. Concurrently, although the global financial crisis originated in the United States, its global nature compelled investors to seek the safest harbor, thereby increasing investment in the US economy. In addition, the Fed Funds rate remained at a low level throughout the period and only began to rise at the end of 2014 and the beginning of 2015, reaching a level of 2.4% in 2019. This development also influenced investors’ preference for higher-yielding investments over US Treasury securities.
Notwithstanding the crisis, GDP growth amounted to 1.7%, yet in 2010–2019 it approached the pre-crisis rate of 2.4%. The sustained growth of the American economy, in conjunction with a balanced monetary policy amidst the debt crisis and the economic slowdown in Europe, has precipitated capital inflows to the United States. Illustrative of this phenomenon is the observation that, while in 2007 liabilities exceeded IIP assets by a mere $1.3 trillion, by 2019 this figure had escalated to an alarming $11.7 trillion.
The third period under review was marked by exceptional circumstances, dominated by the COVID-19 crisis, huge fiscal injections, and a difficult economic recovery in its aftermath. Between 2019 and 2023, the gap between US investment abroad and foreign capital inflows into the US economy (assets - liabilities) continued to widen, reaching the $19.9 trillion mark in 2023.
As was the case in the preceding period, there were only minor changes in the asset structure. Specifically, there was an increase in the shares of direct and portfolio investments in equity and investment funds. Conversely, the liability structure experienced a notable increase in portfolio investments in equity and investment funds, along with a decrease in the share of long-term debt securities under the influence of changes related to the financial crisis and the Fed’s policy. The observed preference for direct investments over portfolio investments, both in terms of liabilities and assets, likely reflects investor risk aversion amid global economic instability, as well as of a diversification of investment portfolios.
The United States economy entered the crisis amid the Federal Reserve’s rate cut from 2.4% in the second quarter to 1.6% in the fourth quarter of 2019, and already in 2020 the rate was reduced to almost zero, remaining at this level until 2022, when the Federal Reserve began a sharp rate hike to curb inflation, as a result of which the rate reached the level of 5.3% in 2023 [Grigoryev et al. 2024]. During the period spanning 2019 to 2021, there was an increase in both liabilities and assets, with liabilities exhibiting a faster rate of growth, attributable to equity investments. Investments in US debt instruments experienced a slower growth rate compared to other instruments. In other words, prior to the Fed’s rate hike, investors favored equities, with foreign investors more interested in investing in the US than US investors were in investing abroad. Conversely, in 2022, a marked shift occurred, with both assets and liabilities experiencing a decline, culminating in a $2.6 trillion enhancement to the IIP. However, in 2023, the asset-liability gap (ALI) once again surpassed the 2021 level by $1.1 trillion, owing to heightened outflows from the US into equity and robust growth in investment in US debt instruments.
As previously mentioned, changes in the IIP were influenced by the weakening and strengthening of the dollar (and, consequently, revaluation of assets), growth and fall of prices in financial markets (and, consequently, increase in US liabilities). Consequently, in 2022, there was a substantial decline in assets and liabilities due to these very factors: falling prices in financial markets following the Federal Reserve’s interest rate increase, as well as the strengthening of the dollar and the revaluation (downward) of US agents’ assets.
Efforts to curb inflation and recover from the repercussions of the COVID-19 crisis have been complicated by the multifaceted policies of the Fed and the US Department of the Treasury. The Fed’s decision to augment the key rate has been accompanied by a sharp surge in short-term issuance, reaching for 70% of total issuance in 2023, well above the standard range of 15–20%. The consequences of the proactive policy of the Ministry of Finance for the economy bear a striking resemblance to the consequences of quantitative easing: lower bond yields and higher asset prices stimulate economic growth [Miran, Roubini 2024].
A summary of the results highlights several important aspects. The composition of liabilities (investments in the US economy) changed significantly in 2007 (the outlined trends continued after the financial crisis): in the pre-crisis period, there was a dominance of long-term debt securities due to high interest rates and a decline in direct equity investments.4 However, by 2023, the structure of liabilities approached the 2000 structure, with direct and portfolio investments in equity and investment funds becoming predominant. This shift was facilitated by several factors, including the restoration of confidence in financial markets, the growth of profitability, the rapid development of new industries (primarily the information technology sector), and a more favorable macroeconomic situation in the United States compared to European countries. The asset structure experienced a more gradual shift, with a declining share of direct investments in capital, accompanied by a concomitant rise in the share of portfolio investments and long-term debt securities.
It is important to acknowledge that, at times, substantial fluctuations in the dollar exchange rate have exerted an influence on US investments in foreign countries. However, this impact is less evident in comparison to that observed in developing countries, given the greater stability of the US dollar in relation to the currencies of developing nations. The sustained period of dollar appreciation that occurred in the second decade of the twenty-first century contributed to the revaluation of US IIP and the widening of the asset-liability gap in favor of the latter. A study by Avdjiev et al. found limited exchange rate effects on investment flows [Avdjiev et al. 2019]. However, there are specific features of the mutual influence of the exchange rate and investment flows: Grossman and Simpson’s work posit a noteworthy hypothesis concerning the coexistence of two multidirectional trends. They argue that a weakening dollar tends to reduce capital flows into developed countries while stimulating investment into emerging markets [Grossman, Simpson, and Brown 2009]. A notable distinction in investor behavior during the Coronacrisis period was evident in a shift in investment strategy, with investors exhibiting a preference for equity over government debt. This inclination may be associated with an escalation in fiscal risks (an increase in government spending without adequate financing can lead to substantial budget deficits and heightened risk for bondholders) and elevated levels of debt [Gómez-Cram, Kung, Lustig 2024].
Between 2018 and 2023, the conventional US stance on the IIP shifted to a “short debt, long equity” approach, signifying an investment strategy where equity investments in assets surpass debt investments in liabilities (refer to Table 2). In other words, as articulated by Lane and Milesi-Ferretti, the United States’ financial posture after 2018 deviated from that of a typical “hedge fund,” as foreign investors found debt instruments to be equally appealing as returns on equity investments [Lane, Milesi-Ferretti 2006].
Table 2. Net investment in debt and equity, 2000–2023, trillion dollars5
|
2000 |
2007 |
2010 |
2019 |
2023 |
|
|
Net investment in debt |
-1.7 |
-5.1 |
-5.9 |
-8.8 |
-9.8 |
|
Net investment in equity |
0.3 |
4.0 |
3.0 |
-1.1 |
-6.9 |
Source: author’s calculations based on BEA data.
The IIP trajectory aligns with Gourinchas and Rey’s theory that portrays the US as a “global venture capitalist,” issuing short-term and fixed-income bonds while primarily investing in capital abroad [Gourinchas and Rey 2007]. This dynamic gives rise to a set of discernible privileges and responsibilities for the United States. The former pertain to the fact that, in a period of stable global economic development, the US receives a higher income from its foreign investments compared to its own payments on liabilities. Conversely, during periods of global economic downturn, the United States’ role shifts, with its financial resources exceeding its outflows, thereby assuming a role akin to a global financial “supply” center.
The dynamics of net investment inflow to the US show an outflow during crisis periods, such as 2008, as well as 2010 (due to the reaction of investors and foreign governments to the crisis, as well as the swap lines opened by the Fed). By contrast, the 2020 pandemic triggered a surge in capital inflows, while outflows (the largest on record since 2000) did not occur until 2023, with inflows into debt instruments exceeding outflows into equity throughout the period (see Figure 4). In the aftermath of the COVID-19 crisis, the Federal Reserve implemented a swift and substantial rise in the key rate, a measure undertaken with the objective of curbing inflation. This rise in the key rate consequently led to an increase in the yield of long-term US debt securities. Concurrently, there was a decline in investment in debt instruments of other countries. Consequently, the net inflow of investments in debt instruments (the difference between investments from outside the US economy and investments of US agents abroad) increased to $960 billion in 2023. As previously mentioned, this substantial increase is concomitant with a notable rise in investments in long-term debt instruments within the liabilities of IIPs. This phenomenon can be attributed, in large part, to the stability of US debt instruments, the monetary policy of the Federal Reserve, and the growth of yields on US Treasury securities during specific periods.
Figure 4. Net foreign investment inflows to the United States (equity and debt investments), $ billion, 2000–2023
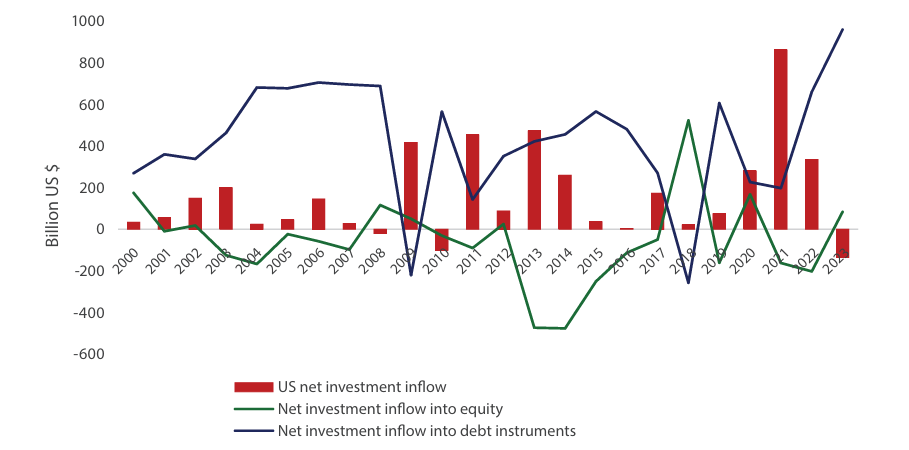
Source: compiled by the author on the basis of data from the US Bureau of Economic Analysis.
Investment strategies of the US, UK, and Germany
Historically, investments in stock markets have proven to be more profitable (see Table 3). However, during periods of economic downturn, long-term government bonds have emerged as a more reliable investment option for investors. A comparison of the average annual index returns before and after the global financial crisis reveals that stock market indices of all selected countries exhibited significantly faster growth compared to long-term government bonds, with the US500 demonstrating the most substantial growth. Despite a slight downturn in 2020 (compared to the average annual growth between 2010 and 2019) due to the pandemic, the US500 demonstrated accelerated growth between 2021 and 2023. While Germany and the UK have exhibited a similar trend since the financial crisis, the disparity between the returns of stock market indices and long-term government bond indices remains comparatively narrower than in the US. In the UK, the stock market index (GB100) experienced a substantial decline in 2020, leading to a negative difference between the indexes.
Table 3. Long-term bond yields and dynamics of stock exchange indices, 2000–2023, %
|
Stock markets |
Long-term government bonds |
||||||
|
US500 |
DE40 |
GB100 |
US |
Germany |
UK |
||
|
2000–2007 |
1.3 |
3.5 |
0.9 |
4.7 |
4.3 |
4.8 |
|
|
2008 |
-17.3 |
-19.8 |
-18.8 |
3.7 |
4.0 |
4.6 |
|
|
2009 |
-22.5 |
-15.9 |
-10.3 |
3.3 |
3.2 |
3.6 |
|
|
2010–2019 |
12.1 |
9.5 |
4.7 |
2.4 |
1.1 |
2.0 |
|
|
2020 |
10.5 |
2.9 |
-11.7 |
0.9 |
-0.5 |
0.4 |
|
|
2021–2023 |
11.0 |
9.2 |
6.2 |
2.8 |
1.1 |
2.4 |
|
|
Difference, %% |
|||||||
|
2000–2007 |
-3.4 |
-0.8 |
-3.9 |
||||
|
2008 |
-21 |
-23.8 |
-23.4 |
||||
|
2009 |
-25.8 |
-19.1 |
-13.9 |
||||
|
2010–2019 |
9.7 |
8.4 |
2.7 |
||||
|
2020 |
9.6 |
3.4 |
-12.1 |
||||
|
2021–2023 |
8.2 |
8.1 |
3.8 |
||||
Source: compiled by the author according to Trading Economics.
The investment strategy employed by the United States does not exhibit significant disparities when compared to the investment strategies employed by developed countries in general. Historically, developed countries have consistently attracted substantial foreign direct investment (FDI), functioning as stabilizing forces during periods of economic turbulence. It is noteworthy that investment in Germany exhibits the least volatility, while investment in the US demonstrates the most volatility. The most significant decline in FDI in the US in 2018 can be attributed to the repatriation of earnings by US companies, leading to negative profits that were reinvested.6 In the year 2020, which was characterized by a global financial crisis, the United States experienced inflows amounting to $148 billion, representing 12.4% of the global total. In contrast, Germany and the United Kingdom experienced outflows. Despite the volatility, over a long period (2007–2014, net of the global financial crisis), FDI inflows to the US were higher than in Germany and the UK.
Changes in long-term government bond yields were observed in all three countries (see Figure 5). It is noteworthy that the 1990s generally exhibited higher values compared to the subsequent decade. Conversely, German government bond yields exhibited a consistent decline following the global financial crisis, reaching negative levels during the pandemic. The post-crisis recovery has had a positive impact on bonds in all three countries, but the sharpest rise was seen in the UK.
Figure 5. Yields on long-term (10-year) government bonds of the United States, Germany, and the United Kingdom, 1990–2023 (annual averages)
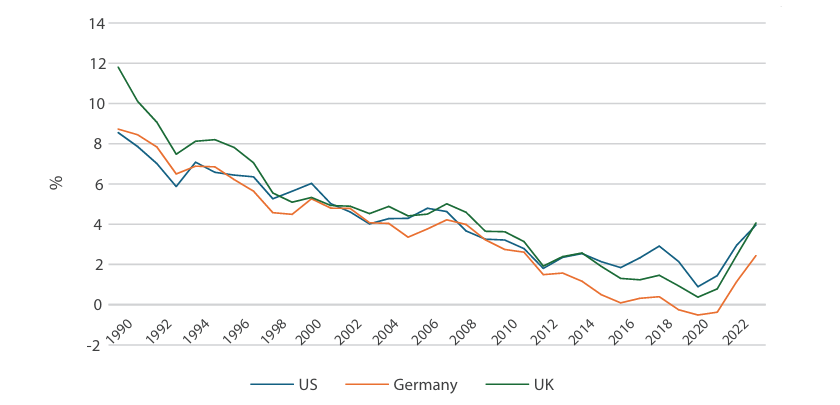
Source: compiled by the author according to FRED data.
In practice, the market for long-term US government bonds has served as the primary source of securities supply, yield, and reliability. The corporate sector received substantial injections of capital, yet it also demonstrated a high level of exchange, particularly from 2020 to 2023, and generated record-breaking dividends of $602.1 billion in 2023, a stark contrast to the patterns observed in previous crises [Janus Henderson 2024].
The study by Janus Henderson reveals an uneven distribution of dividend payments across different regions. For instance, dividend payments to the US accounted for 36.4% of the global total, which is twice the amount paid to Europeans ($300 billion), excluding the UK. Concurrently, the volume of dividend payments in the US tripled over a 13-year period, exhibiting a growth rate that was twice that of the rest of the world [Janus Henderson 2022].
Prior to the global financial crisis, the returns on long-term bonds in the three countries significantly exceeded the growth of stock market indices. However, following the advent of a protracted period of diminished interest rates from 2010 to 2019, a paradigm shift ensued, presenting investors with a dichotomy: the pursuit of elevated returns in financial markets or the dependability of long-term debt instruments. In the final section of this paper, we undertake an examination of the shifts in the geographic composition of portfolio investments in the United States and other regions by US agents. The data reveal that in 2023, the share of portfolio investment in assets and liabilities stood at 56% and 78%, respectively, marking a consistent upward trend since the year 2000.
Geographic structure of US IIP portfolio investments
The structure of US portfolio investment holders has exhibited notable stability throughout the period under consideration, with developed countries maintaining a dominant presence. However, it is noteworthy that following the 2007 financial crisis, there was a decline in the share of developed countries, although in 2023, this share rebounded to 81.8%, as illustrated in Table 4. While developed countries’ portfolio investments primarily comprised debt instruments during the period between the two crises, post-pandemic investments exhibited a notable shift toward equity investments, surpassing debt financing. Conversely, developing countries exhibited a propensity for debt instruments, though with a gradual shift in their investment patterns. Federal Reserve Bank of New York (2024) reports indicate that investors from developed countries allocate a significant portion of their investments to private debt, while investors from developing countries primarily invest in public debt.
Over the entire period under consideration (2000–2023), the largest countries holding US securities are the United Kingdom (even excluding the Cayman Islands7) and Japan, with the United Kingdom investing mainly in equity and Japan in debt securities. A notable shift in the composition of portfolio investment is evident, marked by a decline in China’s share. Furthermore, investment has been declining in absolute terms since 2010. Consequently, the share of BRICS countries has experienced a substantial decline,8 from 19.8% in 2010 (almost equivalent to the EU level of 21.5%) to 8.2% in 2023. Additionally, the share of Russian investments, which primarily took the form of debt instruments, experienced a substantial decline, from $11 billion in 2019 to $1 billion in 2023. Moreover, Brazilian investments also underwent a decline in absolute values following the pandemic, while investments from India and South Asia exhibited an increase.
During the first period (2000–2007), the growth of investments was provided by both “traditional donors”—Japan, Great Britain, European countries and “developing countries”—the main increase was in China. In the second period (2007–2019), developed countries (Cayman Islands, Japan, Luxembourg) again came to the fore, with Russia being the largest country that reduced its investments in the US economy. In the third period (2019–2023), developing countries (mainly the BRICS countries—China, Brazil, Egypt, Russia) also significantly reduced their investment volume, while the inflow was again provided by developed countries, mainly the UK. The inflow of investment from the UK alone was almost four times greater than the reduction in investment by the four developing economies mentioned above. The observed decline in investment by BRICS countries in the US economy reflects growing global economic fragmentation, as well as the existing legal restrictions on the free movement of capital.
Despite a significant inflow of capital from the UK after the Coronacrisis, the country’s share in the structure of portfolio investment in the US declines from 15% in 2000 to 9.8% in 2023, with debt and equity investments distributed in a balanced way over the period–roughly equally. Concurrently, the investment portfolio of the Gulf Cooperation Council (GCC) countries, comprising Saudi Arabia, the United Arab Emirates, Iraq, Kuwait, and Qatar, exhibited a modest rise, reaching 3.7% in 2023. It is noteworthy that this figure represents a decline of 0.2 percentage points during the period 2019 to 2023. The composition of investments by financial instruments within this group of countries has undergone significant alterations. In 2000, capital instruments constituted 61% of the total, while debt instruments accounted for 39%. However, in the aftermath of the global financial crisis, there was a shift in favor of debt instruments, with equity instruments experiencing a decline. However, subsequent to the pandemic, the investment structure exhibited a resurgence of a similar pattern to that of 2000, with a renewed preference for equity over debt. In contrast, the investment structure of European countries has remained relatively stable over the 23-year period. EU countries have demonstrated a consistent preference for debt instruments, prioritizing security and stability over potentially high returns. A similar rationale can be postulated for Chinese investors, who have demonstrated a consistent inclination to invest in debt instruments.
In 2023, the total value of foreign portfolio investments in the United States amounted to approximately $27 trillion, which is equivalent to the value of US non-financial business assets ($29.5 trillion) and is almost 4.5 times less than the value of US household assets. However, it exceeds the value of household liabilities, which totaled $20 trillion in 2023. The total assets of the financial account (flow of funds) amount to $327 trillion, while liabilities total $249 trillion.9
An examination of the asset side reveals a relatively stable pattern of ownership of securities from other countries by US agents between 2001 and 2022 (see Table 5). Developed country securities dominate, accounting for 87% in 2022, with over 74% of these investments allocated to equity. Following 2010, there was a decline in investment in BRICS countries. While there was growth recorded in absolute terms before the pandemic, by 2022, a decline in volumes was observed.
A substantial discrepancy was observed in the investment patterns of the United States across both developed and developing countries in 2022. The analysis revealed that US portfolio investment in these two categories significantly exceeded the investment levels observed in all financial instruments within the United States.10 However, between the two crises, US investment in equity exceeded investment in equity by both developed and developing countries. Conversely, in terms of debt instruments, US investment in the US economy was much higher than US investment in other countries throughout the period.
A more detailed breakdown of the structure (2022, 2019, 2007, and 2000/2001) presents the following picture. Initially, while the inflow of US capital into other countries is less than the outflow of capital from those countries into the US in 2022, the reverse is observed for Japan, the Cayman Islands, and the BRICS countries. Figure 6 illustrates the disparity between foreign investment in capital in the US and US investment in capital abroad. Since the onset of the Coronacrisis, the disparity between foreign and US capital investment has widened considerably for both developed and developing countries. However, the aforementioned countries and the BRICS-5 group constitute exceptions to this trend. The United States has invested more in these countries than these countries have invested in the United States.
Figure 6. Net capital investment inflows to the United States (difference between foreign capital investment in the United States and US investment abroad), $ billion, 2003–2022
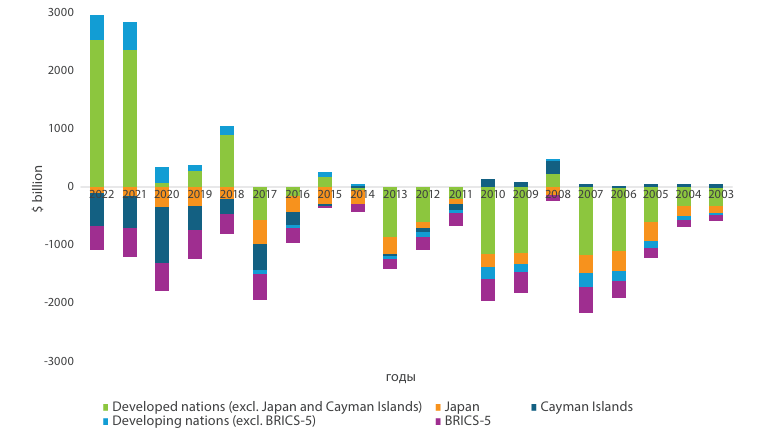
Source: compiled by the author on the basis of data from the US Department of the Treasury.
Secondly, among the most significant partners, Canada was the sole nation exhibiting a surplus of US investment over capital flows to America. This phenomenon was evident as early as 2019, when a positive difference was observed solely in the context of investment in debt securities. This dynamic persisted in 2022. Thirdly, even if US equity investment exceeds reverse investment, the financing differential for debt instruments (in favor of US investment) is so substantial that capital inflows from other countries still exceed capital outflows from the United States. Fourthly, it is noteworthy to observe the considerable surge in capital flows between the United States and the Cayman Islands following 2002, a notable offshore financial center that has established its distinctive position within the global financial architecture through the advancement of its banking sector [Roberts 1995]. The Cayman Islands serve as an attractive hub not only for US hedge funds but also for foreign investors, primarily from Japan and Hong Kong, who utilize the financial center to invest in US equity and debt instruments [Fichtner 2011]. Consequently, the financial center functions as a global hub for portfolio investors. A notable observation is that the EU’s share is comparable in both US agents’ and non-US agents’ holdings of US assets and other countries’ holdings of US assets. However, it is crucial to note the difference in volumes. For instance, from 2019 to 2022, capital inflows into the US in the form of portfolio investment amounted to $1.34 trillion (with the UK at $3.1 trillion), while capital outflows from the US into European portfolio investment totaled $0.28 trillion (with the UK at $1.8 trillion). This indicates that capital flows are imbalanced.
Table 4. Structure of Foreign Holders of US Securities, 2000–2023, %11
|
2023 |
2019 |
2010 |
2007 |
2000 |
|||||||||||
|
Securities, total |
Capital |
Debt |
Securities, total |
Capital |
Debt |
Securities, total |
Capital |
Debt |
Securities, total |
Capital |
Debt |
Securities, total |
Capital |
Debt |
|
|
EU |
27.5 |
27.9 |
27.1 |
26.3 |
26.0 |
26.5 |
21.5 |
25.1 |
20.2 |
26.1 |
29.1 |
24.7 |
23.4 |
29.0 |
18.2 |
|
BRICS12 |
8.2 |
3.7 |
12.8 |
11.0 |
3.6 |
16.3 |
19.8 |
6.2 |
24.7 |
13.3 |
2.7 |
18.3 |
4.2 |
1.9 |
6.4 |
|
UK |
9.8 |
10.6 |
8.9 |
8.6 |
11.6 |
6.5 |
7.5 |
11.5 |
6.0 |
9.4 |
13.5 |
7.5 |
15.0 |
18.8 |
11.5 |
|
Canada |
7.6 |
10.6 |
4.5 |
6.1 |
11.1 |
2.6 |
4.0 |
10.6 |
1.6 |
4.9 |
11.1 |
1.9 |
5.9 |
10.2 |
1.9 |
|
Japan |
9.3 |
6.1 |
12.6 |
11.1 |
6.9 |
14.1 |
13.0 |
8.0 |
14.8 |
12.2 |
7.0 |
14.7 |
12.1 |
8.5 |
15.5 |
|
China |
5.3 |
2.3 |
8.5 |
7.5 |
2.2 |
11.4 |
15.1 |
4.5 |
18.8 |
9.4 |
0.9 |
13.5 |
2.6 |
0.1 |
4.9 |
|
Amount |
67.7 |
61.2 |
74.4 |
70.6 |
61.4 |
77.4 |
80.9 |
65.9 |
86.1 |
75.3 |
64.3 |
80.6 |
63.2 |
68.5 |
58.4 |
|
Cayman Islands |
8.8 |
11.5 |
6.0 |
9.1 |
12.6 |
6.7 |
7.0 |
10.3 |
5.8 |
7.6 |
8.9 |
6.9 |
3.6 |
2.6 |
4.4 |
|
The others |
28.8 |
29.6 |
28.0 |
27.7 |
28.3 |
27.3 |
27.3 |
28.3 |
26.9 |
26.5 |
27.8 |
25.9 |
35.8 |
29.0 |
42.1 |
|
Developed countries13 |
81.8 |
88.5 |
74.9 |
78.7 |
87.7 |
72.2 |
67.4 |
83.7 |
61.5 |
73.3 |
86.1 |
67.4 |
73.5 |
83.5 |
64.3 |
|
Developing countries |
17.8 |
11.5 |
24.4 |
21.0 |
12.3 |
27.4 |
31.4 |
16.2 |
36.8 |
24.5 |
13.9 |
29.4 |
17.5 |
14.3 |
20.5 |
Fractions of the amounts are deferred % by column. Equity and debt in total equal “securities”
Source: compiled by the author on the basis of data from the US Department of the Treasury.
Table 5. Structure of US assets in other countries, %
|
2022 |
2019 |
2010 |
2007 |
2001 |
|||||||||||
|
Securities, total |
Capital |
Debt |
Securities, total |
Capital |
Debt |
Securities, total |
Capital |
Debt |
Securities, total |
Capital |
Debt |
Securities, total |
Capital |
Debt |
|
|
EU |
23.4 |
24.5 |
20.4 |
22.9 |
23.2 |
22.0 |
21.4 |
19.3 |
26.1 |
23.7 |
22.8 |
26.4 |
26.3 |
26.4 |
26.2 |
|
BRICS14 |
5.9 |
7.1 |
2.3 |
6.3 |
7.5 |
3.2 |
8.7 |
11.0 |
3.5 |
7.3 |
9.2 |
2.0 |
2.7 |
2.7 |
2.9 |
|
UK |
10.1 |
9.5 |
11.7 |
11.7 |
10.7 |
14.4 |
14.9 |
13.5 |
18.2 |
15.9 |
13.6 |
22.0 |
22.3 |
21.7 |
23.6 |
|
Canada |
9.0 |
7.1 |
14.2 |
8.5 |
6.3 |
14.4 |
10.4 |
8.8 |
13.9 |
8.2 |
7.2 |
10.7 |
9.2 |
5.6 |
17.6 |
|
Japan |
7.9 |
8.2 |
6.8 |
8.8 |
9.8 |
6.3 |
7.7 |
9.7 |
3.3 |
8.3 |
10.1 |
3.3 |
9.1 |
10.6 |
5.5 |
|
China |
1.8 |
2.2 |
0.5 |
1.7 |
2.2 |
0.5 |
1.5 |
2.2 |
0.1 |
1.4 |
1.8 |
0.1 |
0.1 |
0.2 |
0.1 |
|
Amount |
56.2 |
56.5 |
55.5 |
58.2 |
57.4 |
60.3 |
63.1 |
62.3 |
65.0 |
63.3 |
62.9 |
64.4 |
69.6 |
66.9 |
75.8 |
|
Cayman Islands |
19.2 |
18.7 |
20.4 |
15.4 |
15.8 |
14.2 |
5.5 |
3.6 |
9.7 |
7.6 |
4.4 |
16.1 |
3.1 |
2.2 |
5.1 |
|
The others |
24.6 |
24.8 |
24.1 |
26.4 |
26.8 |
25.5 |
31.4 |
34.1 |
25.3 |
29.1 |
32.7 |
19.5 |
27.4 |
30.9 |
19.1 |
|
Developed countries15 |
86.6 |
86.6 |
86.5 |
85.1 |
85.4 |
84.0 |
81.1 |
78.4 |
87.4 |
82.6 |
79.3 |
91.4 |
86.2 |
85.7 |
87.5 |
|
Developing countries |
13.4 |
13.4 |
13.5 |
15.0 |
14.6 |
16.0 |
18.9 |
21.6 |
12.6 |
17.4 |
20.7 |
8.6 |
13.8 |
14.3 |
12.5 |
Fractions of total amounts are deferred % by column. Equity and debt total equal “securities”.
Source: compiled by the author on the basis of data from the US Department of the Treasury.
Conclusions
The US international investment position has evolved substantially since the beginning of the 21st century, reflecting shifting global financial system and the distinct characteristics of the country’s monetary policy. Notably, a persistent trend has been observed of an escalating disparity between US assets and liabilities, which by 2023 attained a level of USD 20 trillion.
This study examined the evolution of capital flows from 2000 to 2007, 2007 to 2019, and 2019 to 2023. The analysis revealed a transition from the traditional “long equity, short debt” investment strategy for developed countries to a new paradigm where the United States now attracts debt and investment from the rest of the world. Although the US economy faced three crises of different nature between 2000 and 2023, by the end of the period the liability structure approached the 2000 structure, which was dominated by equity investment. It is noteworthy that the asset structure exhibited a gradual increase in the share of portfolio investments. In the aftermath of the global financial crisis, the IIP “recovered,” marked by a decline in the share of derivatives. The US economy maintained its appeal for investments from across the globe, driven by assurances of safety and security. The global financial crisis of 2020 led to an influx of additional capital into the United States, resulting in a surge of more than $4.1 trillion in equity and debt instruments. This occurred in the context of a substantial post-crisis increase in the key rate of the US Federal Reserve System and price growth in financial markets. Concurrently, the composition of liabilities underwent a shift, with investments in equities outperforming those in US government debt. This suggests that foreign investors may have prioritized higher-yielding and riskier assets in anticipation of the US economic recovery from the pandemic. This shift may also indicate a diminished confidence in government debt, possibly attributable to heightened fiscal risks and substantial debt levels.
The geographic structure of US portfolio investments and investments of other countries in the US remains relatively stable. The primary partners are developed countries (e.g., the EU, UK, Canada, and Japan) and offshore financial centers (e.g., the Cayman Islands) that function as intermediaries for investors and hedge funds. Concurrently, capital flows to major developing countries, including the BRICS nations, have declined since the outbreak of the COVID-19 crisis.
Despite the relatively modest size of the IIP in relation to the assets held by US households, its share of GDP has exhibited an upward trend over the past two decades. A substantial increase in the financing of the US economy by the rest of the world has been observed, notably from European countries.
In the near future, several factors are likely to continue shaping the US IIP. The influence of high government debt and fiscal risks on the preferences of foreign investors is expected to persist. The attractiveness of US risk assets is likely to remain in place due to the robust performance of the corporate sector and the nation’s innovative economy. Concurrently, potential shifts in monetary policy and global economic trends may precipitate capital reallocation and modifications in the composition of the US IIP.
Bibliography
Aliber, R., 2020. Why Did the United States Evolve from the Largest International Creditor in 1980 to the Largest International Debtor in 1990? Atlantic Economic Journal, Vol. 48. P. 410. DOI: 10.1007/s11293-020-09695-x.
Avdjiev, S., Bruno, V., Koch, C., Shin, H. S., 2019. The Dollar Exchange Rate as a Global Risk Factor: Evidence from Investment. IMF Economic Review, Vol. 67. P. 151–173. DOI: 10.1057/s41308-019-00074-4.
BEA. International Investment Position of the United States. Available at: https://apps.bea.gov/iTable/?reqid=19&step=2&isuri=1&categories=survey
Bernanke, B. S., Bertaut, C. C., DeMarco, L., Kamin, S. B., 2011. International Capital Flows and the Return to Safe Assets in the United States, 2003-2007. FRB International Finance Discussion Paper. No. 1014. Available at: https://papers.ssrn.com/sol3/papers.cfm?abstract_id=1837780
Blanchard, O., Milesi-Ferretti, G. M., 2009. Global Imbalances: In Midstream? IMF Staff Position Note. Available at: https://www.imf.org/external/pubs/ft/spn/2009/spn0929.pdf
Federal Reserve Bank of New York, 2024. Foreign Portfolio Holdings of US Securities. Available at: https://ticdata.treasury.gov/resource-center/data-chart-center/tic/Documents/shla2023r.pdf
Fichtner, J., 2016. The anatomy of the Cayman Islands offshore financial center: Anglo-America, Japan, and the role of hedge funds. Review of International Political Economy, Vol. 23. DOI: 10.1080/09692290.2016.1243143.
Gómez-Cram, R., Kung, H., Lustig, H., 2024. The Dollar, Financial Conditions, and the Return on US Assets. Federal Reserve Bank of Kansas City. Available at: https://www.kansascityfed.org/Jackson%20Hole/documents/10341/Hanno_Lustig_Paper_JH.pdf
Gourinchas, P.-O., Rey, H., 2007. From World Banker to World Venture Capitalist: US External Adjustment and the Exorbitant Privilege. In: G7 Current Account Imbalances: Sustainability and Adjustment / Clarida R. H. (ed.). University of Chicago Press. P. 11. Available at: https://www.nber.org/system/files/chapters/c0121/c0121.pdf
Grigoryev, L.M., Zharonkina, D.V., Maykhrovich, M.-Y., Kheifets, E.A., 2024. Mechanism of regime changes of global inflation in 2012–2023. Moscow University Economics Bulletin. No 1. P. 72-95 (in Russian). Available at: https://doi.org/10.55959/MSU0130-0105-6-59-1-4
Grigoryev, L.M., Morozkina, A.K., 2021. Successful unsustainable industrialization of the world: 1880-1913. Moscow: Nestor-Istoria (in Russian).
Grossman, A., Simpson, M., Brown, C. J., 2009. The impact of deviation from relative purchasing power parity equilibrium on US foreign direct investment. The Quarterly Review of Economics and Finance, Vol. 49, No. 2. P. 521–550. DOI: 10.1016/j.qref.2008.02.001.
Higgins, M., Klitgaard, T., Tille, C., 2006. Borrowing without Debt? Understanding the US International Investment Position. Federal Reserve Bank of New York Staff Reports. Staff Report no. 271. 2006. Available at: https://www.newyorkfed.org/medialibrary/media/research/staff_reports/sr271.pdf
Jackson, J.K., 2009. Foreign Ownership of US Financial Assets: Implications of a Withdrawal. Congressional Research Service. Available at: https://ecommons.cornell.edu/server/api/core/bitstreams/9267602b-39ca-4acb-962e-bd5fa43c0cae/content
Janus Henderson, 2024. Global Perspectives on Economic Outlook. Available at: https://cdn.janushenderson.com/webdocs/H052332_0124_EN.pdf
Janus Henderson, 2022. Investment Insights. Available at: https://cdn.janushenderson.com/webdocs/H049590_0222+-+English+Global.pdf
Lane, R. R., Milesi-Ferretti, G. M., 2006. The External Wealth of Nations Mark II: Revised and Extended Estimates of Foreign Assets and Liabilities, 1970-2004. IMF Working Paper No. 2006/069. Available at: https://www.imf.org/en/Publications/WP/Issues/2016/12/31/The-External-Wealth-of-Nations-Mark-II-Revised-and-Extended-Estimates-of-Foreign-Assets-and-18942
Lipsey, R. E., 1977. Changing Patterns of International Investment in and by the United States. NBER Working Paper No. 2240. Available at: https://www.nber.org/system/files/working_papers/w2240/w2240.pdf
Miran, S., Roubini, N., 2024. Activist Treasury Issuance and the Tug-of-War Over Monetary Policy. July 2024. Hudson Bay Capital Research. Access mode: https://www.hudsonbaycapital.com/documents/FG/hudsonbay/research/635102_Activist_Treasury_Issuance_-_Hudson_Bay_Capital_Research.pdf
OECD, 2018. FDI. Available at: https://www.oecd.org/investment/investment-policy/FDI-in-Figures-July-2018.pdf
Perelstein, J., 2009. Macroeconomic Imbalances in the United States and Their Impact on the International Financial System. The Levy Economics Institute Working Paper. Available at: https://papers.ssrn.com/sol3/papers.cfm?abstract_id=1335287
Roberts, S.M., 1995. Small Place, Big Money: The Cayman Islands and the International Financial System. Economic Geography, Vol. 71, No. 3. DOI: 10.2307/144310.
Summers, L., 2006. Reflections on Global Account Imbalances and Emerging Markets Reserve Accumulation. L.K. Jha Memorial Lecture, Reserve Bank of India, Mumbai, India. Available at: https://www.harvard.edu/president/news-speeches-summers/2006/reflections-on-global-account-imbalances-and-emerging-markets-reserve-accumulation/#figure1
Swiston, A. J., 2005. A Global View of the US Investment Position. IMF Working Paper WP/05/181. Available at: https://www.imf.org/en/Publications/WP/Issues/2016/12/31/A-Global-View-of-the-U-S-18524
Appendix A
Figure A1. US Asset Structure, 2000–2023, %
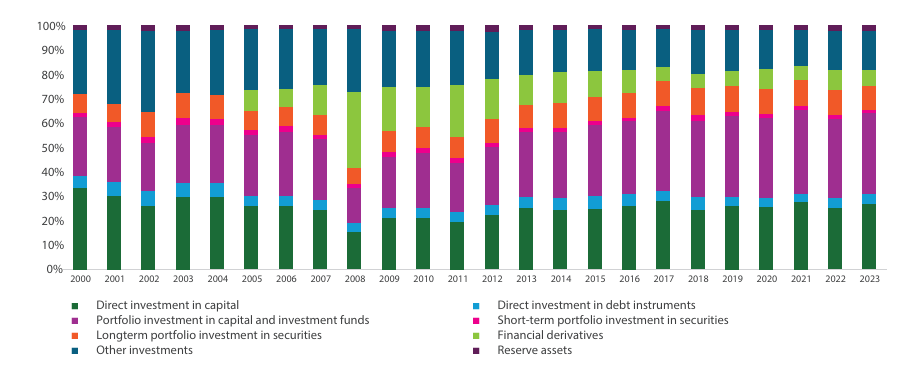
Source: compiled by the author on the basis of data from the US Bureau of Economic Analysis.
Figure A2. US liabilities, 2000–2023, %
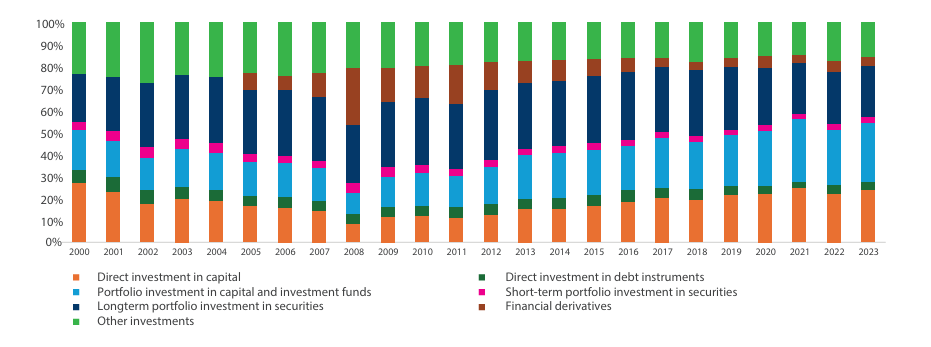
Source: compiled by the author on the basis of data from the US Bureau of Economic Analysis.
Notes
1 According to BEA: https://apps.bea.gov/iTable/?reqid=19&step=2&isuri=1&categories=survey&_gl=1*1wtuv3e*_ga*MTM4NDI4NzkyNy4xNzI0MTk5NzA1*_ga_J4698JNNNFT*MTcyNDIwMjYwMy4yLjEuMTcyNDIwMjYxOS40NC4wLjA.#eyJhcHBpZCI6MTksInNN0ZXBzIjpbMSwyLDMsM10sImRhdGEiOltbImNhdGVnb3JpZXMiLCJTdXJ2ZXkiXSxbIk5JUEFfVGFibGVfTGlzdCIsIsIjEzNyJdLFsiRmlyc3RfWWVhciIsIsIjIwMDAiXSxbIkxhc3RfWWVhciIsIsIjIwMjMiXSxbIlNjYWxlIiwiLTkiXSxbIlNlcmllcyIsIkEiXV19
2 IIP here = ratio of growth in IIP assets minus growth in IIP liabilities to current GDP (minus means greater growth in capital imports).
3 Estimated value, may not be the same as the US investment position.
4 The share of investments in derivatives, which dominated the asset mix but is not included in our analysis, peaked in 2008. A more detailed structure is available in Appendix A.
5 Net investment in debt is the sum of debt instruments in assets and official reserves less debt instruments in liabilities, net investment in equity is the sum of portfolio and direct investment in equity in assets less portfolio and direct investment in equity in liabilities.
6 OECD, 2018. FDI. Available at: https://www.oecd.org/investment/investment-policy/FDI-in-Figures-July-2018.pdf
7 It should be taken into account that the Cayman Islands is an offshore financial center and is used by investors from other countries.
8 Brazil, Russia, India, China, South Africa, Iran, UAE, Saudi Arabia, Ethiopia, and Egypt.
9 Author’s calculations based on US Federal Reserve data.
10 Since information for 2023 on US investment in other countries is not available, we use the latest available year, 2022.
11 The structure is presented excluding investments of international and regional organizations.
12 Brazil, Russia, India, China, South Africa, Iran, UAE, Saudi Arabia, Ethiopia, and Egypt.
13 According to BIS classification.
14 Brazil, Russia, India, China, South Africa, Iran, UAE, Saudi Arabia, Ethiopia, and Egypt.
15 According to BIS classification.

1.jpg)
