Сдвиги в торговых взаимосвязях США и Китая со странами-партнерами: что изменилось за «пятилетку бурных перемен»
[To read the article in English, just switch to the English version of the website.]
Гнидченко Андрей Андреевич — к.э.н., ведущий эксперт Центра макроэкономического анализа и краткосрочного прогнозирования (ЦМАКП), старший научный сотрудник ИНП РАН, старший научный сотрудник НИУ ВШЭ.
SPIN РИНЦ: 2707-6004
ORCID: 0000-0002-0678-8324
ResearcherID: D-7048-2017
Scopus AuthorID: 55935059300
Для цитирования: Гнидченко А.А. Сдвиги в торговых взаимосвязях США и Китая со странами-партнерами: что изменилось за «пятилетку бурных перемен» // Современная мировая экономика. Том 2. 2024. №2(6).
Ключевые слова: торговля, товары, услуги, США, Китай, страны-партнеры.
Настоящая работа выполнена в рамках программы фундаментальных исследований НИУ ВШЭ в 2024 г. (ТЗ-52). Предварительные результаты работы докладывались 25 апреля 2024 г. на круглом столе департамента мировой экономики НИУ ВШЭ «Перспективы развития мировой экономики в условиях глобальной экономической фрагментации».
Аннотация
В статье отслеживаются сдвиги в экономических взаимосвязях США и Китая со странами-партнерами в контексте торговли товарами и услугами. Разрабатывается авторская группировка важнейших стран-партнеров и регионов: Китай, США, Северная Америка (кроме США), Европа, АСЕАН, страны альянса Chip 4 (Южная Корея, Япония и Тайвань), Индия, прочие страны. Выделяется три этапа динамики торговых взаимосвязей: активная фаза торговой войны США и Китая (июль 2018 г. – январь 2020 г.); постковидное восстановление мировой экономики (февраль 2020 г. – январь 2022 г.); геополитическая турбулентность (февраль 2022 г. – настоящее время).
В части внешней торговли товарами описываются изменения взаимодействия США и Китая с группами стран-партнеров на каждом этапе; отдельно рассматривается динамика внешней торговли услугами США по странам-партнерам. Демонстрируется, что устойчивое сокращение торговли между США и Китаем по товарам отмечалось только на третьем этапе (спад во время торговой войны оказался временным), тогда как по услугам – начиная со второго этапа. На третьем этапе – параллельно со снижением дефицита торговли товарами США с Китаем – произошел рост дефицита со странами АСЕАН, альянса Chip 4 и Северной Америки (частично за счет реэкспорта китайских товаров). При этом Китай с 2020 г. достиг рекордной доли в мировом экспорте товаров (около 16%) и продолжает ее удерживать.
Представлена авторская ранжировка стран и регионов мира, которые в перспективе могут оказывать наиболее сильное влияние на рост и структурную перестройку мировой торговли: Китай, АСЕАН, Северная Америка, Россия и Индия. Учитывались такие факторы, как сохранение исключительных позиций Китая в мировой торговле даже в условиях противостояния со странами Запада, активное интеграционное развитие и высочайшая торговая связность стран АСЕАН, значительные усилия США к реинтеграции Северной Америки и возвращению высокотехнологичных производств на континент, очень высокая заинтересованность России в развитии сотрудничества в рамках БРИКС и децентрализации международных платежей, а также становление Индии как крупного рынка сбыта.
Введение
Значительные изменения во внешнеторговых взаимосвязях крупнейших экономик мира — Китая и США — стали происходить с конца 2018 г. Прежде всего это отражалось в сдвигах географической структуры их внешней торговли товарами. Такая структурная перестройка периодизируется на три этапа.
Первый этап соответствует активной фазе торговой войны между США и Китаем (с июля 2018 г. по январь 2020 г.1) в форме взаимного повышения пошлин на импорт, завершившейся заключением торговой сделки. Однако она не означала прекращение противостояния, а скорее перевела его в другие форматы. Сразу же после подписания торговой сделки начался второй этап, на котором сильное влияние на международную торговлю оказывали сначала локдауны во время пандемии коронавируса, а затем — активное постковидное восстановление мировой экономики2. Этот импульс практически исчерпался к началу 2022 г. С февраля начался третий этап, характеризующийся крайне высокой геополитической напряженностью на фоне вспыхнувшего конфликта России и Украины, а затем — обострения противоречий и в других регионах мира (Китай — Тайвань; Израиль — Палестина, с прямыми последствиями для судоходства в Красном море).
Цель исследования — систематизировать изменения во внешнеторговых взаимосвязях США и Китая с основными группами стран-партнеров на всех этапах структурной перестройки глобальной торговли, а также сделать вывод о вероятных странах-драйверах перспективных структурных изменений. Для достижения этой цели используется методология, основанная на статистическом анализе, группировке объектов по географическому и отраслевому признаку, экспертной оценке перспектив на основе экстраполяции трендов.
В разделе 1 представлена и обоснована авторская группировка стран-партнеров США и Китая. В разделе 2 освещены этапы динамики международной торговли двух указанных стран в разрезе ключевых групп стран-партнеров, с акцентом на особенности каждого из трех этапов (на основе анализа национальных статистических данных США и Китая о торговле товарами и данных ВТО о торговле услугами). В разделе 3 предложен взгляд автора на перспективы дальнейшего развития мировой торговли.
1. Принципы группировки стран-партнеров США и Китая
Для удобства и лаконичности представления информации в статье используется парный принцип анализа: оценки торговых взаимосвязей со странами-партнерами представляются с точки зрения двух крупнейших экономик мира — США и Китая. При этом выделяется несколько групп стран-партнеров с учетом следующих принципов.
Во-первых, в явном виде представляются данные по торговле с другой крупнейшей страной-конкурентом (для США — с Китаем, а для Китая — с США). Это позволяет фиксировать последствия торговой войны и других шоков для прямой торговли США и Китая (разрез, который при обсуждении глобальной торговли рассматривается наиболее часто).
Во-вторых, демонстрируются оценки торговли с Северной Америкой (Мексика и Канада). Для США выделение этого региона позволяет отследить процессы реинтеграции Северной Америки в рамках сменившего NAFTA и вступившего в силу в июле 2020 г. соглашения USMCA [Brookings 2024]. Для Китая сфокусированное рассмотрение торговли с Северной Америкой дает возможность фиксировать в том числе и непрямую торговлю с США через посредничество мексиканских и канадских компаний.
В-третьих, описывается динамика торговли США и Китая со странами Европы (включены ЕС, Великобритания, Швейцария, Норвегия, Исландия3), представляющими третью сторону в балансе крупнейших экономик. Это позволяет иллюстрировать изменение зависимости Европы от Китая (которая особенно велика в таких секторах, как производство электромобилей и оборудование для солнечной энергетики — см. [Mazzocco 2023]) и ее взаимосвязей с США. Для ЕС сейчас сильные позиции Китая в торговле выступают, по крайней мере в восприятии европейской элиты, важной геополитической проблемой, для изучения которой Еврокомиссия финансирует исследовательский проект China Horizons (задействован консорциум из девяти исследовательских центров4).
В-четвертых, активно развивающийся азиатский регион разбивается на три группы: динамично растущие страны интеграционного блока АСЕАН5 (для США — потенциальная замена хотя бы части китайского импорта, для Китая — крупное и близко расположенное интеграционное объединение с хорошей логистикой6), страны альянса Chip 4 (Южная Корея, Япония и Тайвань, тяготеющие к западным странам и в последние годы вовлеченные в американский проект по координации поставок чипов7), Индия (для США — традиционный партнер в Азии8 и противовес Китаю, для последнего — один из «зарождающихся» потенциальных конкурентов).
Наконец, все остальные партнеры, в том числе Россия, объединяются в группу «прочие». Отметим, что выделение России в отдельную категорию в контексте проводимого в статье анализа нецелесообразно. Для США Россия не является существенным поставщиком, кроме ряда сырьевых товаров. Для Китая Россия, даже после активизации взаимодействия в 2022–2023 гг., все еще остается менее значимым рынком сбыта, чем, например, Индия (за исключением отдельных товаров, таких как автомобили).
Работа опирается в первую очередь на национальные статистические данные США и Китая о торговле товарами, данные CPB World Trade Monitor, используемые для оценки доли двух крупнейших экономик в глобальной торговле, данные UN Comtrade для представления отраслевого разреза торговли товарами, а также данные ВТО по торговле услугами.
2. Этапы динамики торговли США и Китая
2.1. Торговля товарами
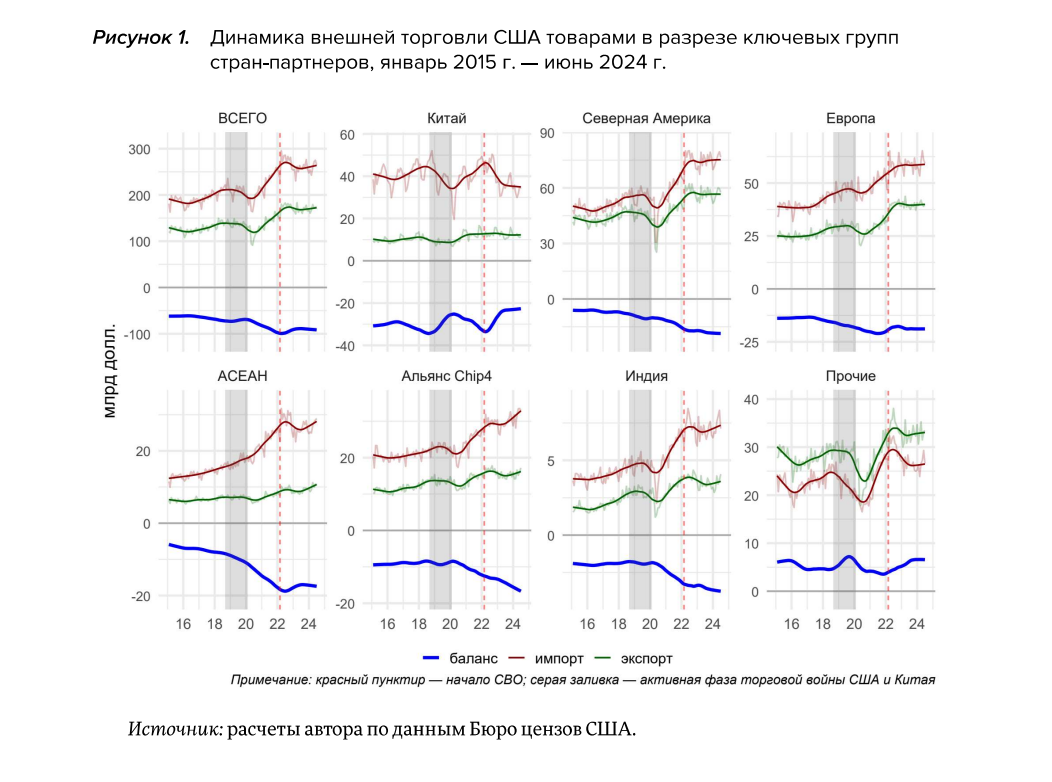
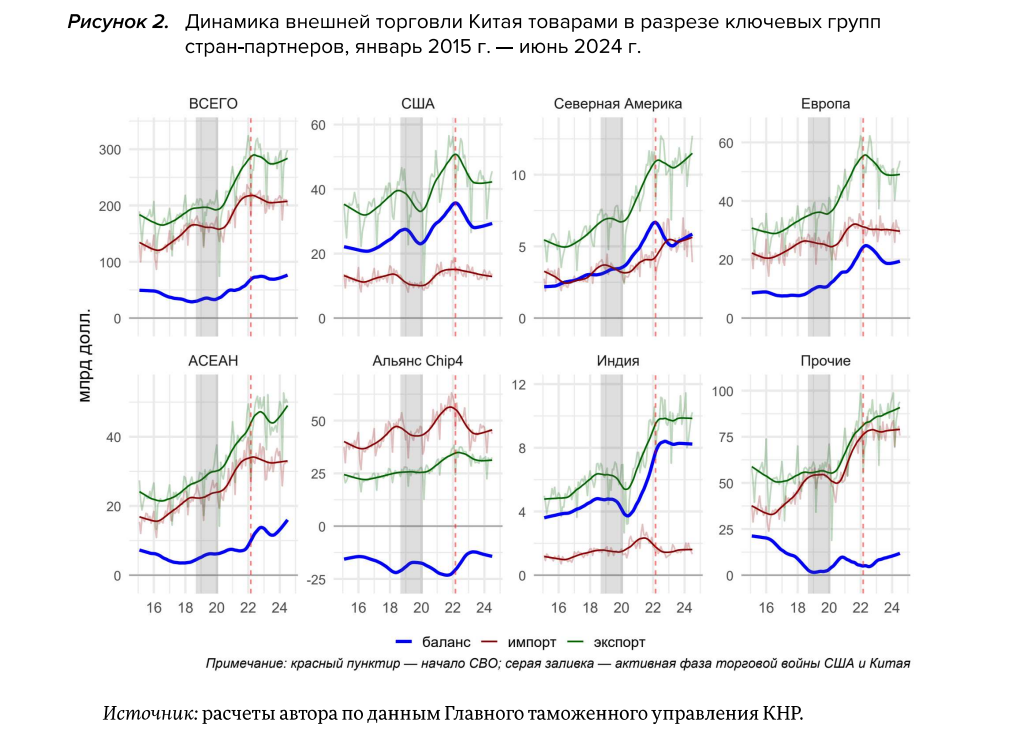
На первом этапе — в процессе торговой войны между США и Китаем — инициировавшие ее США формально добились снижения импорта из Китая (и, соответственно, уменьшения дефицита торговли с Китаем), однако сальдо торговли США в целом со всеми странами-партнерами почти не изменилось за этот период, хотя импорт перестал расти (см. рисунок 1). Сочетание данных факторов указывает на то, что импорт из Китая был замещен ввозом товаров из других стран. Впрочем, реальное замещение было лишь частичным, поскольку сразу стали развиваться маршруты реэкспорта китайской продукции в США через страны АСЕАН (в первую очередь через Вьетнам) и Северной Америки (Мексика, Канада)9. Косвенно об этом свидетельствует увеличение профицита внешней торговли Китая с отмеченными регионами: по сравнению с уровнем июля 2018 г. к январю 2020 г. рост профицита торговли Китая с АСЕАН по тренду оценивается в 46%, с Северной Америкой — в 17% (см. рисунок 2). От торговой войны несколько выиграла Европа, которая смогла нарастить экспорт в США (хотя и здесь, вероятно, частично присутствовал реэкспорт из Китая). Важно отметить, что реэкспортные процессы не были отличительной особенностью только первого этапа — в дальнейшем они не только не прекратились, но и, по косвенным признакам, даже усилились.
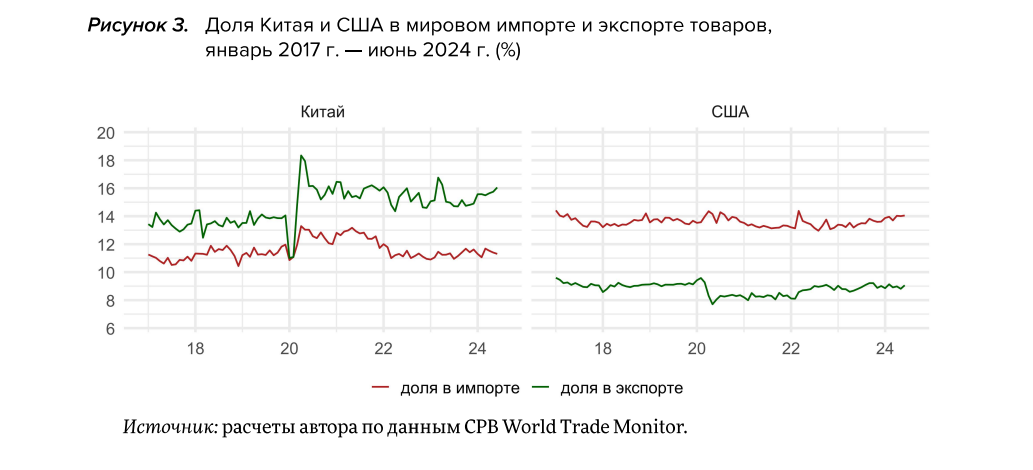
На втором этапе — в процессе пандемии и постковидного перегрева мировой экономики — опережающий восстановительные темпы рост импорта во многих странах мира, в том числе в США, позволил Китаю существенно нарастить экспорт товаров и выйти на рекордную долю в мировом экспорте — с 14% в 2019 г. до 16% в 2021 г. (см. рисунок 3)10. В дальнейшем, в 2023 г., доля Китая немного снизилась, но к середине 2024 г. вновь вернулась на высокую планку: во II квартале 2024 г. она составила 15,8% (тогда как доля США в мировом импорте — 14,0%)11.
На данном этапе США стали закрывать дополнительную потребность в импорте, в первую очередь за счет поставок из стран АСЕАН и альянса Chip 4 (последние в период торговой войны практически не наращивали поставки в США, в отличие от постпандемийного периода, когда существенно возросли поставки тайваньской и корейской электроники12). Продолжилось медленное наращивание импорта из Европы, наметились ускорение поставок из Северной Америки и активизация сотрудничества с Индией. Хотя в последнем случае масштабы поставок незначительны, их резкий рост указывает на углубление сотрудничества, особенно в части импорта драгоценных камней и металлов, продукции машиностроения. В то же время итоги торговой войны в плане сокращения дефицита торговли с Китаем сошли на нет — к концу 2021 г. дефицит почти вернулся к уровню до начала торговой войны (а по китайским данным, значительно превысил этот уровень).
Китай в 2020–2021 гг. существенно нарастил экспорт в страны Северной Америки, что указывает на активные реэкспортные процессы в этом регионе. Основной рост пришелся на Мексику (+44% в 2021 г. к 2019 г., в первую очередь в части продукции машиностроения, металлургии и пластмасс), тогда как экспорт в Канаду увеличился в меньшей степени (+37%, в основном за счет оборудования и металлоизделий). К концу периода также достиг пиковых значений профицит торговли Китая с Европой и Индией (помимо машин и оборудования, внесших большой вклад в прирост экспорта Китая по обоим направлениям, значительно увеличились поставки химических продуктов в Индию, а также металлоизделий и автомобилей — в Европу). Взаимодействие со странами АСЕАН носило комплексный характер: в ходе постковидного восстановления существенно рос как экспорт, так и импорт Китая из АСЕАН. Дефицит торговли Китая со странами альянса Chip 4, в противовес общей тенденции, углубился и достиг нижней точки к концу периода (активно закупались высокотехнологичные товары). Торговля с прочими странами, как и со странами АСЕАН, развивалась сбалансированно: отмечен уверенный рост как экспорта, так и импорта.
На третьем этапе — в процессе быстрых геополитических структурных изменений — произошло резкое охлаждение торговых взаимосвязей между двумя крупнейшими экономиками мира. США уже к 2023 г. сильно сократили импорт из Китая (особенно в части оборудования, электроники, пластмасс и металлоизделий), прямой дефицит торговли с Китаем (без учета возможного реэкспорта) стал минимальным за последние годы, притом что совокупный дефицит торговли США остался на тех же высоких уровнях. Дефицит со странами АСЕАН, альянса Chip 4 и Северной Америки параллельно углубился настолько, что по состоянию на начало 2024 г. по каждой из этих групп стран он оказался ненамного ниже дефицита торговли с Китаем, тогда как по всем отмеченным группам стран, вместе взятым, существенно превысил дефицит торговли с Китаем. Исключение — торговля США с европейскими странами, где произошел структурный сдвиг к несколько более активному экспорту в ЕС (в первую очередь за счет замещения российского топлива).
Китай в период геополитических структурных изменений значительно нарастил экспорт в страны блока АСЕАН (наибольший вклад в прирост дали Сингапур, Малайзия и Таиланд, а в товарном разрезе — транспортные средства, химические продукты, пластмассы, металлоизделия, а также нефтепродукты), продолжил поддерживать высокий уровень поставок в страны Северной Америки (в обоих случаях по косвенным признакам имел место реэкспорт в США). В то же время произошло явное сокращение экспорта китайских товаров в Европу (на фоне медленного роста импорта), а также заметно снизился ввоз товаров из стран альянса Chip 4 в Китай (следствие их переориентации на США). Наконец, рост торговли Китая с прочими странами после ускорения в 2020–2021 гг. замедлился: импорт товаров стагнирует, тогда как экспорт умеренно растет.
Значимость России как рынка сбыта китайских товаров даже на третьем этапе остается ограниченной (за исключением автомобилей, объем поставок которых возрос за последние два года более чем в пять раз). Значительную роль Россия сыграла во второй половине 2022 г. — первой половине 2023 г. Тогда поставки Китая в США, Европу и даже страны АСЕАН просели, а экспорт в группу прочих стран, кроме России, перестал расти (см. рисунок 4). До середины 2023 г. Россия была одной из немногих стран, устойчиво наращивающих спрос на китайские товары — вследствие резко активировавшейся потребности в замещении продукции из западных стран.
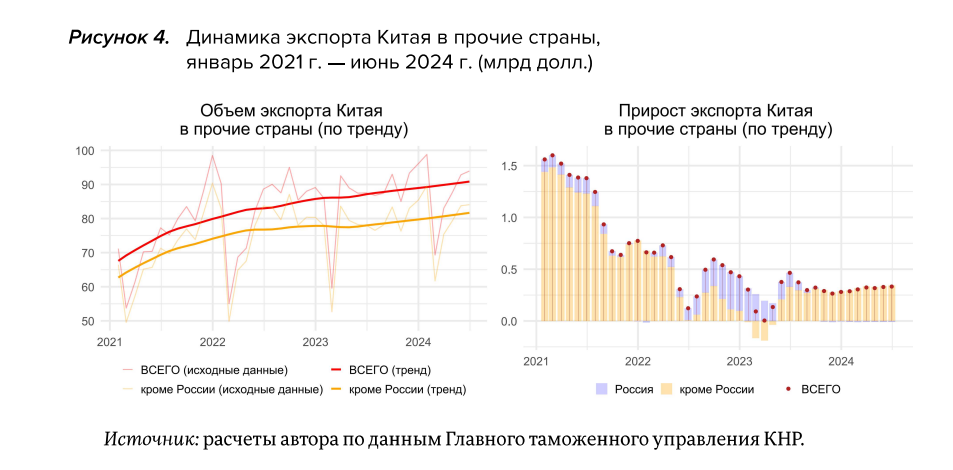
Однако во второй половине 2023 г. — первой половине 2024 г. рост экспорта Китая в Россию прекратился, в то время как в прочие страны, напротив, восстановился. Это указывает на завершение процесса стихийной структурной перестройки российского рынка после санкций. Дальнейший рост торговли, как ожидается, должен быть связан с развитием новых форматов взаимодействия с дружественными странами, в том числе в рамках БРИКС.
2.2. Торговля услугами
Ограниченность данных по международной торговле услугами в разрезе стран-партнеров не позволяет провести такой же подробный анализ для услуг. Поэтому в этой части рассмотрение динамики внешнеторговых взаимосвязей производится только со стороны США (данные по Китаю не представлены в разрезе стран-партнеров). Для расчетов используются данные ВТО; на момент анализа последним доступным периодом выступает 2023 г.13.
В целом важной характеристикой внешней торговли США выступает устойчиво положительный баланс торговли услугами — в противовес ситуации с товарами, — что отражает уникальную роль США как поставщика продуктов интеллектуальной собственности, финансовых и консультационных услуг, а также туристическую привлекательность этой страны.
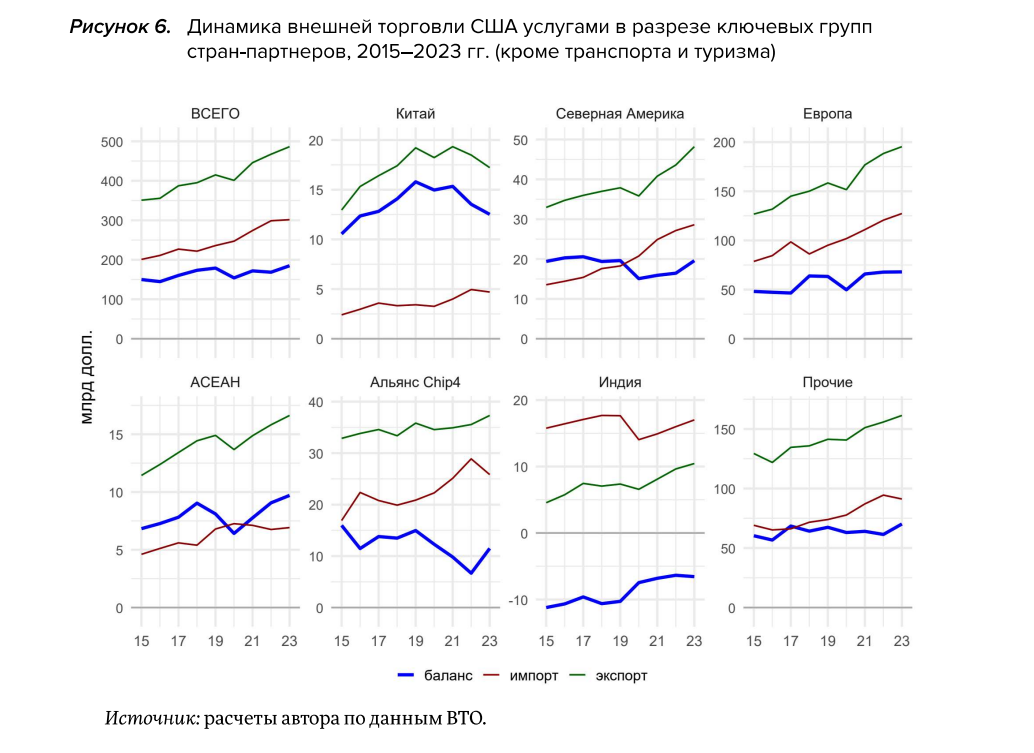
Переломным моментом для структуры торговых взаимосвязей США с другими государствами в части услуг стал 2020 г.: положительный баланс внешней торговли услугами с Китаем и странами альянса Chip 4 резко сократился, тогда как со странами АСЕАН продолжил увеличиваться (см. рисунок 5). В последующие годы данный процесс активно развивался: к 2022 г. импорт услуг из стран альянса Chip 4 возрос настолько, что сравнялся с экспортом.

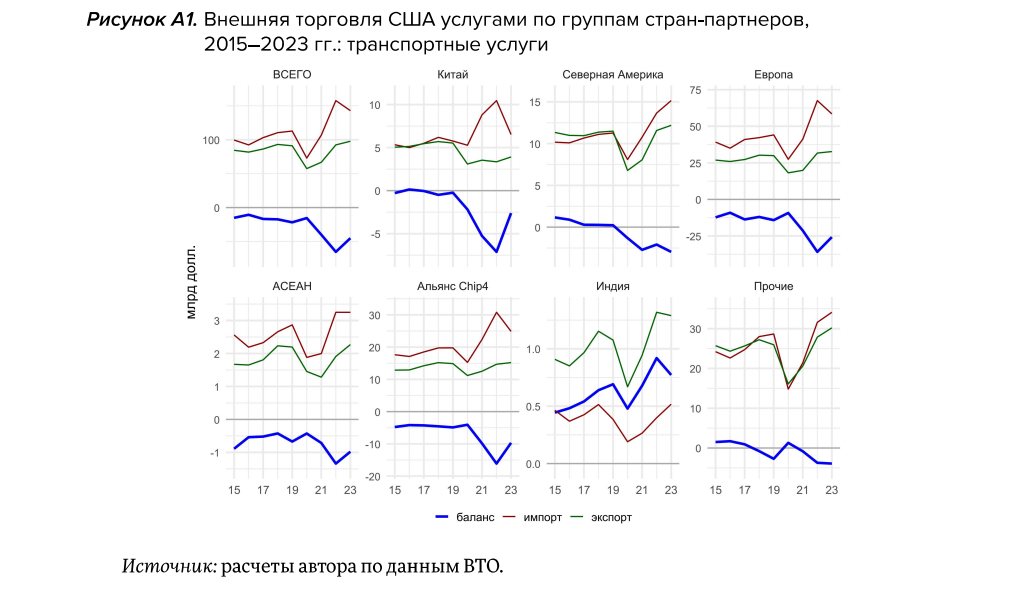
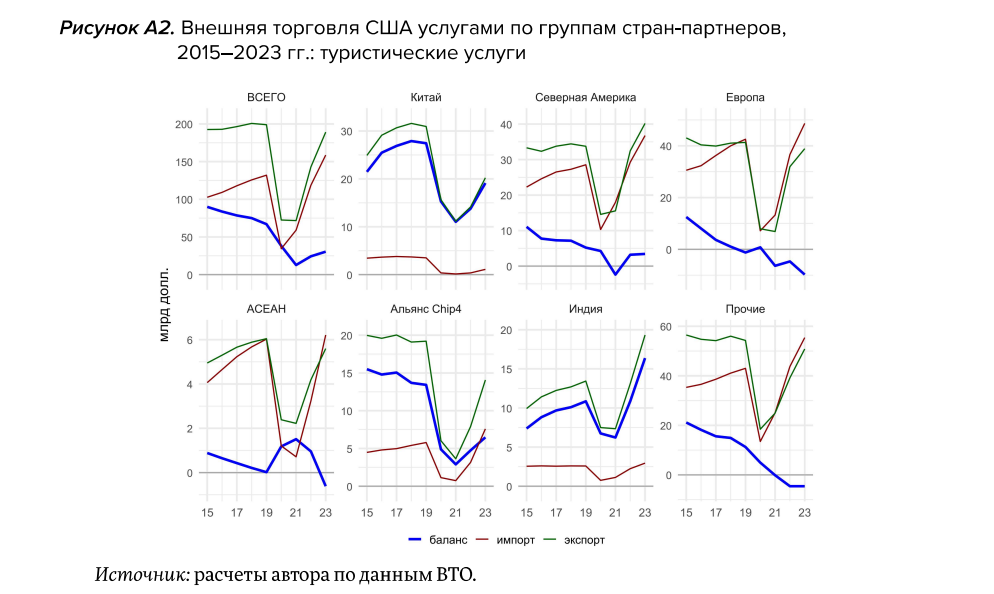
Однако за общей картинкой скрывается крайне неоднородная динамика по видам услуг (визуализация динамики внешней торговли США по крупным категориям услуг представлена в Приложении А). Резкое ухудшение торгового баланса по услугам в 2020 г. и его продолжавшееся падение впоследствии во многом обусловлены двумя секторами — транспортными услугами (см. рисунок А1), динамика которых, как правило, повторяет динамику торговли товарами, и туризмом (см. рисунок А2), сдерживаемым сначала жесткими коронавирусными ограничениями, а потом неполным восстановлением спроса.
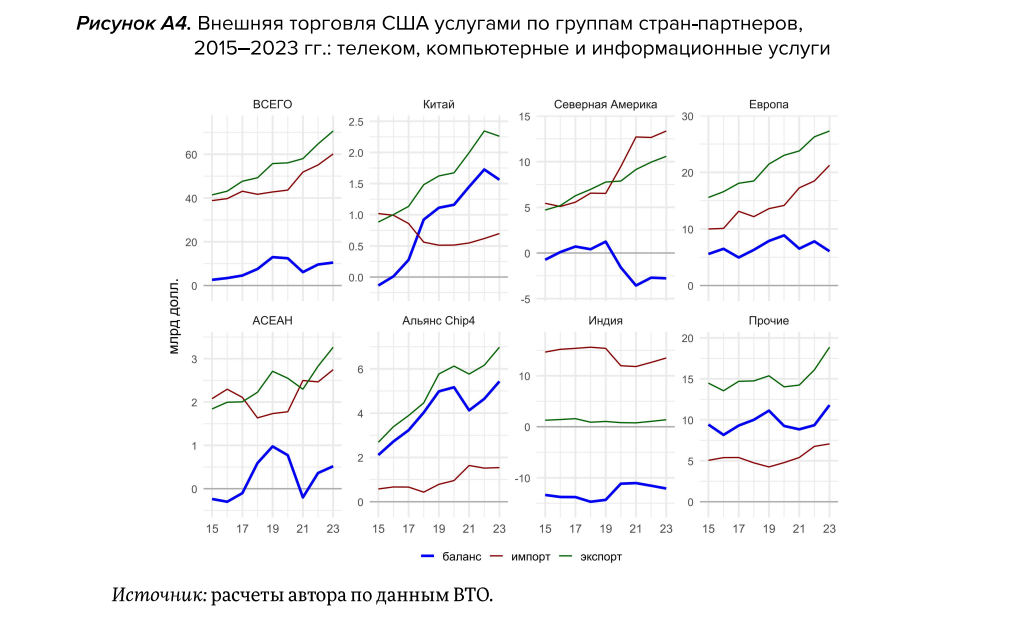
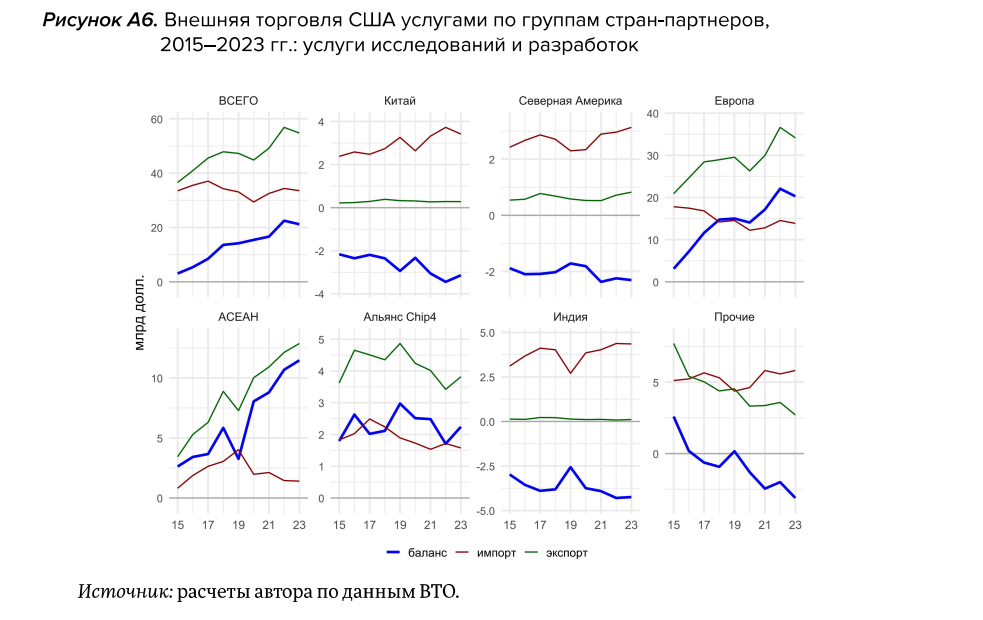
Более взвешенное представление об изменении торговых взаимосвязей США с другими странами по услугам формируется при исключении этих двух видов услуг из рассмотрения (см. рисунок 6). При таком фокусе прекращение роста экспорта услуг в Китай с 2020 г. также очевидно; в то же время сокращение этого показателя началось только в 2022–2023 гг. (тогда как импорт китайских услуг возрос, хоть и остался небольшим по объемам). После 2020 г. тренды экспорта США в Китай по видам услуг разошлись: если в части страховых и финансовых услуг (рисунок А3), а также платы за пользование интеллектуальной собственностью (рисунок А5) экспорт устойчиво снижался, то в части телекома, компьютерных и информационных услуг (рисунок А4) он быстро рос вплоть до 2023 г.; в части услуг исследований и разработок14 (рисунок А6) зависимость Китая от США как была, так и осталась незначительной.
Начиная с 2021 г. рост внешней торговли услугами США со странами Северной Америки ускорился, а со странами Европы и группой прочих стран сохранил те же темпы, что и в предшествующие годы. С другой стороны, динамика внешней торговли услугами со странами АСЕАН и Индией затормозилась (а импорт из Индии снизился из-за вытеснения индийских компьютерных и информационных услуг североамериканскими). Наиболее выраженным структурным изменением постковидного периода стал резкий рост импорта услуг из стран альянса Chip 4 — во многом за счет телекома, компьютерных и информационных услуг, а также платы за пользование интеллектуальной собственностью (в последнем случае рост не был устойчивым и отмечался только в 2022 г.). Вероятно, это обусловлено запуском процесса перенесения серии высокотехнологичных производств из развитых стран Азии в США.
3. Контуры перспектив мировой торговли
Из проведенного анализа торговой статистики следует, что позиции Китая в мировой торговле товарами по-прежнему остаются исключительными — его доля в мировом экспорте после временного снижения в 2023 г. снова стала увеличиваться и в апреле–мае 2024 г. остается почти на 2 п. п. выше, чем до пандемии коронавируса.
Безусловно, динамика Китая в перспективе будет оставаться основным фактором, определяющим изменение мировой торговли. В этом отношении трудно согласиться с результатами исследования Boston Consulting Group [Gilbert et al. 2024], что первостепенное влияние на мировую торговлю на горизонте до 2032 г. будут оказывать индустриализация и реинтеграция Северной Америки (см. таблицу 1). В таких прогнозах не учитывается фактор реэкспорта из Китая в США: масштабы развития интеграции США, Канады и Мексики в прямой статистике торговли явно преувеличиваются. В случае замедления роста китайского экспорта последует и снижение активности интеграционных процессов в Северной Америке.
Таблица 1. Пять геополитических драйверов мировой торговли до 2032 г.
|
Драйвер |
Геополитические процессы |
Прирост торговли, |
Оценка влияния |
|
|
BCG |
автор |
|||
|
США |
Промышленная и торговая политика усиливают интеграцию в USMCA |
с Китаем -197 с Канадой/Мексикой +466 |
1 |
3 |
|
Китай |
Торговые барьеры с Западом отклоняют торговлю в другие направления |
с АСЕАН +616 с Западом -62 |
2 |
1 |
|
АСЕАН |
Выгодные сдвиги в цепочках поставок, сохранение низких издержек и торговой связности |
с Китаем +616 с Японией/Кореей +210 |
3 |
2 |
|
Индия |
Становление страны как крупного рынка и участника цепочек поставок |
с Западом +180 с Китаем +124 |
4 |
5 |
|
Россия |
Переориентация торговли на дружественные страны после западных санкций |
с Китаем +134 с Индией +26 |
5 |
4 |
Источник: [Gilbert et al. 2024]; последний столбец — экспертная оценка автора
В то же время трудно не согласиться с ожиданиями высокой роли стран АСЕАН в формировании будущего мировой торговли: их активный рост сотрудничества со всеми «полюсами» глобальной экономики (США, Китай, прочие страны Азии, в том числе Индия) и уникальные логистические возможности делают их второй по значимости силой, формирующей глобальные тренды. Низкие издержки — фактор, который сейчас имеет значение при переносе производств из Китая — в долгосрочной перспективе могут и не сохраниться15, однако это, как показывает опыт Китая, не всегда ведет к критичному замедлению роста.
Третья сила — Северная Америка: несмотря на падение доли в мировом ВВП, у этого блока стран остаются большие шансы на возвращение целого ряда производств, прежде всего высокотехнологичных, особенно в случае активного сотрудничества со странами альянса Chip 4. Несмотря на то что процесс переноса производств может занимать далеко не один год, косвенным свидетельством серьезности таких намерений выступают данные о заметном росте импорта высокотехнологичных услуг в США из стран альянса в 2022 г.
Россия, несмотря на относительно небольшой в глобальном масштабе размер ВВП, может выступить четвертой силой: во-первых, она будет влиять на международную торговлю на крупных рынках (топливо, металлы, удобрения, продовольствие); во-вторых, она как заинтересованный игрок будет двигать процесс децентрализации расчетов в мировой торговле во взаимодействии со странами БРИКС и Ближнего Востока. Важно отметить, что интерес к БРИКС активно растет — так, в июне стало известно о намерении вступить в объединение в том числе ряда стран АСЕАН16, — что в долгосрочной перспективе делает БРИКС фактически главной площадкой, консолидирующей интересы стран так называемого «глобального Юга». А учитывая высокую роль АСЕАН в динамике мировой торговли в последние годы, это обстоятельство может подтолкнуть и без того активный рост торговли «Юг — Юг»17.
Наконец, Индия как крупнейшая по населению страна мира, безусловно, также будет определять ландшафт мировой торговли (в первую очередь в качестве крупного рынка сбыта), но в настоящий момент остаются сомнения, в какой степени она сможет выступать в роли инициатора глобальных перемен. Вероятно, она будет в большей степени выступать как участник широких коалиций (в первую очередь со странами АСЕАН).
Заключение
В работе выделено три этапа динамики внешнеторговых взаимосвязей двух крупнейших экономик мира — активная фаза торговой войны США и Китая, постковидное восстановление мировой экономики, геополитическая турбулентность. Для каждого этапа описываются изменения взаимодействия США и Китая с Северной Америкой, Европой, АСЕАН, странами альянса Chip 4 (Южной Кореей, Японией и Тайванем), Индией и прочими странами.
Устойчивое сокращение торговли между США и Китаем по товарам отмечалось только на третьем этапе (поскольку сокращение объемов торговли во время торговой войны оказалось временным и было нивелировано схемами реэкспорта и последующим наращиванием импорта США из Китая), тогда как по услугам — начиная со второго этапа (сразу после введения коронавирусных ограничений, хотя без учета транспортных и туристических услуг произошло скорее не сокращение, а стагнация торгового взаимодействия двух стран). Со стороны как США, так и Китая развивалось внешнеторговое сотрудничество с другими поставщиками и рынками сбыта. Углубился дефицит торговли США со странами АСЕАН, альянса Chip 4, Северной Америки; Китай же существенно усилил взаимодействие с АСЕАН, Индией и прочими странами.
Представлена авторская оценка значимости стран и регионов мира для будущего роста и структурной перестройки мировой торговли. Наиболее динамичными странами и регионами в долгосрочной перспективе могут стать Китай, АСЕАН, Северная Америка, Россия и Индия.
Библиография
Alfaro L., Chor D. Global supply chains: The looming “Great Reallocation”. 2023. NBER working paper 31661. Режим доступа: https://doi.org/10.3386/w31661
Bi S. Cooperation between China and ASEAN under the building of ASEAN Economic Community // Journal of Contemporary East Asia Studies. 2021. Vol. 10. Issue 1. P. 83–107. Режим доступа: https://doi.org/10.1080/24761028.2021.1888410
Bown C.P. The US–China trade war and Phase One agreement // Journal of Policy Modeling. 2021. Vol. 43. Issue 4. July–August. P. 805–843. Режим доступа: https://doi.org/10.1016/j.jpolmod.2021.02.009
Brookings (2024). USMCA Forward 2024: Gearing up for a successful review in 2026. Report. Режим доступа: https://www.brookings.edu/collection/usmca-forward-2024/
Chau V., Martinez M.C., Kim T., Spray J.A. Global value chain and inflation dynamics. IMF working paper 2024/062. 2024. March 22. Режим доступа: https://www.imf.org/en/Publications/WP/Issues/2024/03/22/Global-Value-Chain-and-Inflation-Dynamics-546651
Gilbert M., Lang N., Mavropoulos G., McAdoo M., Konomi T. Jobs, national security, and the future of trade. Boston Consulting Group. 2024. January 08. Режим доступа: https://www.bcg.com/publications/2024/jobs-national-security-and-future-of-trade
Kim Y., Rho S. The US–China chip war, economy–security nexus, and Asia // Journal of Chinese Political Science. 2024. Vol. 29. Режим доступа: https://doi.org/10.1007/s11366-024-09881-7
Kitazume K., Onishi T., Cho Y. Chinese goods navigate alternate trade routes to US shores // Nikkei Asia. 2019. June 1. Режим доступа: https://asia.nikkei.com/Spotlight/Datawatch/Chinese-goods-navigate-alternate-trade-routes-to-US-shores
Mazzocco I. Balancing act: Managing European dependencies on China for climate technologies. CSIS Briefs. 2023. Dec. 13. Режим доступа: https://www.csis.org/analysis/balancing-act-managing-european-dependencies-china-climate-technologies
UNCTAD. Trade and development report 2022. Development prospects in a fractured world: Global disorder and regional responses. Geneva: United Nations Publications, 2023. Режим доступа: https://unctad.org/publication/trade-and-development-report-2022
Vanvari N. Reliable, reticent, or reluctant? India and US–China rivalry // Indo-Pacific Security: US–China rivalry and regional states’ responses / N. Khoo, G. Nicklin, A.C. Tan (eds.). London: World Scientific, 2024.
Приложения
Приложение А


Примечания
1 Первые масштабные тарифы в рамках торговой войны введены 6 июля 2018 г., а 15 января 2020 г. США и Китай оформили первую фазу торговой сделки [Bown 2021].
2 Важным последствием активного восстановления, в том числе за счет фискальных стимулов, стал беспрецедентный в XXI веке рост инфляции в развитых странах [Chau et al. 2024].
3 В национальных статистических данных США и Китая по внешней торговле группировки стран по регионам мира различаются. Например, если в группировке США Турция относится к Европе, то в китайской группировке — к Азии. В обеих группировках Россия, Украина и Беларусь относятся к Европе, но в рамках настоящего исследования представляется более правильным определить Европу как более узкую общность развитых стран, ориентирующихся на западные ценности. Таким образом, Россия, Украина, Беларусь и ряд других стран (таких как Сербия, Молдова и некоторые другие) в рамках настоящего исследования отнесены к группе прочих стран.
5 В блок входят 10 стран: Индонезия, Малайзия, Сингапур, Таиланд, Филиппины, Бруней, Вьетнам, Лаос, Мьянма, Камбоджа.
6 Сейчас Китай и АСЕАН выступают друг для друга крупнейшими торговыми партнерами. Важно, что Китай публично заявляет о возможности совместного развития инфраструктурных проектов с АСЕАН: в частности, в рамках предложенной Си Цзиньпином инициативы «Морского Шелкового пути XXI века» [Bi 2021].
7 Стратегии отдельных стран на рынке чипов исследуются, например, в работе [Kim and Rho 2024].
8 С поправкой на сохранение Индией за собой «стратегической автономии» [Vanvari 2024].
9 См., в частности, анализ Nikkei Asia [Kitazume et al. 2019].
10 Оценки доли Китая в мировом экспорте приводятся по данным CPB World Trade Monitor.
11 Это нужно иметь в виду при интерпретации периодически публикуемых негативных новостей об экспорте Китая, как, например, было в марте 2024 г. (см.: https://www.reuters.com/markets/asia/chinas-march-exports-imports-shrink-miss-forecasts-by-big-margins-2024-04-12/).
12 Здесь и далее, отраслевой разрез торговли исследован по годовым данным UN Comtrade на уровне 2 знаков ТН ВЭД. Изучение более глубоких отраслевых деталей выходит за рамки цели исследования.
13 Trade in services annual dataset, обновление от июля 2024 г.: https://www.wto.org/english/res_e/statis_e/trade_datasets_e.htm
14 Исследования и разработки — продажа результатов научно-исследовательской деятельности (в том числе оформленных патентами); плата за пользование интеллектуальной собственностью — продажа права пользования ими, а также объектами интеллектуальной собственности. Отсутствие зависимости Китая от США по исследованиям и разработкам говорит об опоре на собственные силы в научной работе.
15 Так, цены импортной продукции из Вьетнама в США уже начинают расти [Alfaro and Chor 2023].
16 В июне помощник президента России Юрий Ушаков подтвердил подачу заявок на вступление в БРИКС со стороны Таиланда и Малайзии — см.: https://www.interfax.ru/russia/967942
17 Торговля «Юг — Юг» представляет собой торговлю между развивающимися странами. Согласно докладу о торговле и развитии ЮНКТАД [UNCTAD 2023], доля такой торговли возросла с 11% в 1995 г. до 25% в 2020 г.


.jpg)

